https://github.com/jokkedk/webgrind
Xdebug Profiling Web Frontend in PHP
https://github.com/jokkedk/webgrind
debugging-tool php xdebug
Last synced: 12 months ago
JSON representation
Xdebug Profiling Web Frontend in PHP
- Host: GitHub
- URL: https://github.com/jokkedk/webgrind
- Owner: jokkedk
- License: other
- Created: 2011-01-19T17:13:31.000Z (over 15 years ago)
- Default Branch: master
- Last Pushed: 2024-07-12T20:02:02.000Z (almost 2 years ago)
- Last Synced: 2025-04-28T13:58:41.658Z (about 1 year ago)
- Topics: debugging-tool, php, xdebug
- Language: PHP
- Homepage:
- Size: 532 KB
- Stars: 3,306
- Watchers: 147
- Forks: 410
- Open Issues: 55
-
Metadata Files:
- Readme: README.md
- License: license.txt
Awesome Lists containing this project
README
          Webgrind

========

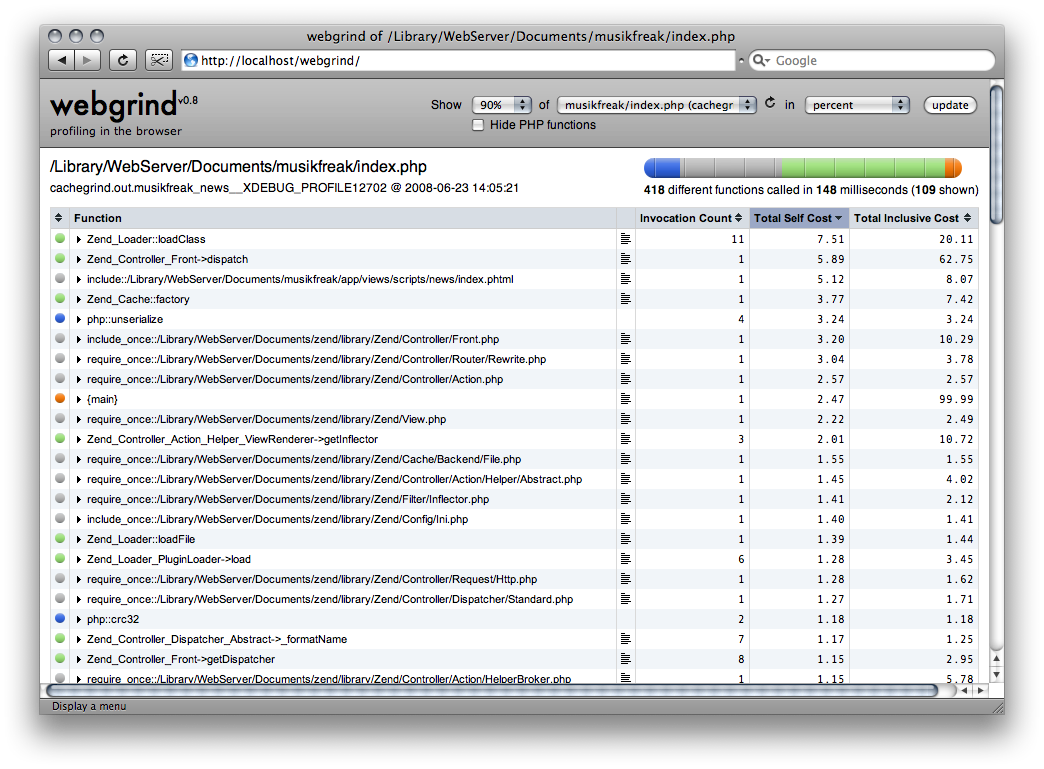
Webgrind is an [Xdebug](http://www.xdebug.org) profiling web frontend in PHP. It implements a subset of the features of [kcachegrind](https://kcachegrind.github.io/) and installs in seconds and works on all platforms. For quick'n'dirty optimizations it does the job. Here's a screenshot showing the output from profiling:


Features

--------

  * Super simple, cross platform installation - obviously :)

  * Track time spent in functions by self cost or inclusive cost. Inclusive cost is time inside function + calls to other functions.

  * See if time is spent in internal or user functions.

  * See where any function was called from and which functions it calls.

  * Generate a call graph using [gprof2dot.py](https://github.com/jrfonseca/gprof2dot)

Suggestions for improvements and new features are more than welcome - this is just a start.

Installation

------------

  1. Download webgrind

  2. Unzip package to favourite path accessible by webserver.

  3. Load webgrind in browser and start profiling

Alternatively, on PHP 5.4+ run the application using the PHP built-in server

with the command `composer serve` or `php -S 0.0.0.0:8080 index.php` if you

are not using Composer.

For faster preprocessing, give write access to the `bin` subdirectory, or compile manually:

  * Linux / Mac OS X: execute `make` in the unzipped folder (requires GCC or Clang.)

  * Windows: execute `nmake -f NMakeFile` in the unzipped folder (requires Visual Studio 2015 or higher.)

See the [Installation Wiki page](https://github.com/jokkedk/webgrind/wiki/Installation) for more.

Use with Docker

---------------

Instead of uploading webgrind to a web server or starting a local one, you can use the [official Docker image](https://hub.docker.com/r/jokkedk/webgrind) to

quickly inspect existing xDebug profiling files. To use the Docker image, run the following command with

`/path/to/xdebug/files` replaced by the actual path of your profiling files.

```

docker run --rm -v /path/to/xdebug/files:/tmp -p 80:80 jokkedk/webgrind:latest

```

Now open `http://localhost` in your browser. After using webgrind you can stop the Docker container by pressing

`CTRL / Strg` + `C`.

To use the built-in file viewer, mount the appropriate files under `/host` in the container.

Credits

-------

Webgrind is written by [Joakim Nygård](http://jokke.dk) and [Jacob Oettinger](http://oettinger.dk). It would not have been possible without the great tool that Xdebug is thanks to [Derick Rethans](http://www.derickrethans.nl).

Current maintainer is [Micah Ng](https://github.com/alpha0010).
