https://github.com/jonocarroll/ggeasy
ggplot2 shortcuts (transformations made easy)
https://github.com/jonocarroll/ggeasy
Last synced: 6 months ago
JSON representation
ggplot2 shortcuts (transformations made easy)
- Host: GitHub
- URL: https://github.com/jonocarroll/ggeasy
- Owner: jonocarroll
- Created: 2017-11-09T06:54:21.000Z (over 8 years ago)
- Default Branch: master
- Last Pushed: 2025-06-18T00:18:34.000Z (about 1 year ago)
- Last Synced: 2025-12-05T03:41:28.744Z (8 months ago)
- Language: HTML
- Homepage: https://jonocarroll.github.io/ggeasy/
- Size: 16 MB
- Stars: 277
- Watchers: 10
- Forks: 20
- Open Issues: 34
-
Metadata Files:
- Readme: README.Rmd
- Changelog: NEWS.md
- Funding: .github/FUNDING.yml
Awesome Lists containing this project
- awesome-ggplot2 - ggeasy
README
---
output: github_document
always_allow_html: yes
---
```{r, echo = FALSE}
knitr::opts_chunk$set(
collapse = TRUE,
comment = "#>",
fig.path = "man/figures/"
)
```
# ggeasy 
[](https://github.com/jonocarroll/ggeasy/blob/master/tests/README.md)
[](https://ci.appveyor.com/project/jonocarroll/ggeasy)
[](https://github.com/jonocarroll/ggeasy/actions/workflows/R-CMD-check.yaml)
[](https://app.codecov.io/gh/jonocarroll/ggeasy?branch=master)
[](https://CRAN.R-project.org/package=ggeasy)
You know how to make `ggplot2` graphics, right? No worries. Piece of cake.
Now, can you please rotate the `x` axis labels to vertical?
`ggeasy` is here to make that a little easier.
## Installation
You can install the latest released version of `ggeasy` from CRAN with:
```{r cran-installation, eval = FALSE}
install.packages("ggeasy")
```
or the bleeding-edge development version from GitHub with
```{r gh-installation, eval = FALSE}
# install.packages("remotes")
remotes::install_github("jonocarroll/ggeasy")
```
## Reference
See the [`pkgdown` site](https://jonocarroll.github.io/ggeasy/).
[\@amrrs](https://github.com/amrrs) a.k.a. [\@1littlecoder](https://twitter.com/1littlecoder) has produced a video walkthrough using `ggeasy` which covers some of the major features:
[](https://youtu.be/iAH1GJoBZmI)
[Sharon Machlis](https://www.infoworld.com/profile/sharon-machlis/) has a great [article](https://www.infoworld.com/article/2256726/easier-ggplot-with-the-ggeasy-r-package.html) detailing using the package, as well as a video
[](https://www.youtube.com/watch?v=-2ZvQQ583pI)
[Jenny Richmond](https://www.youtube.com/@jenrichmondPhD) walks through some helpful features:
[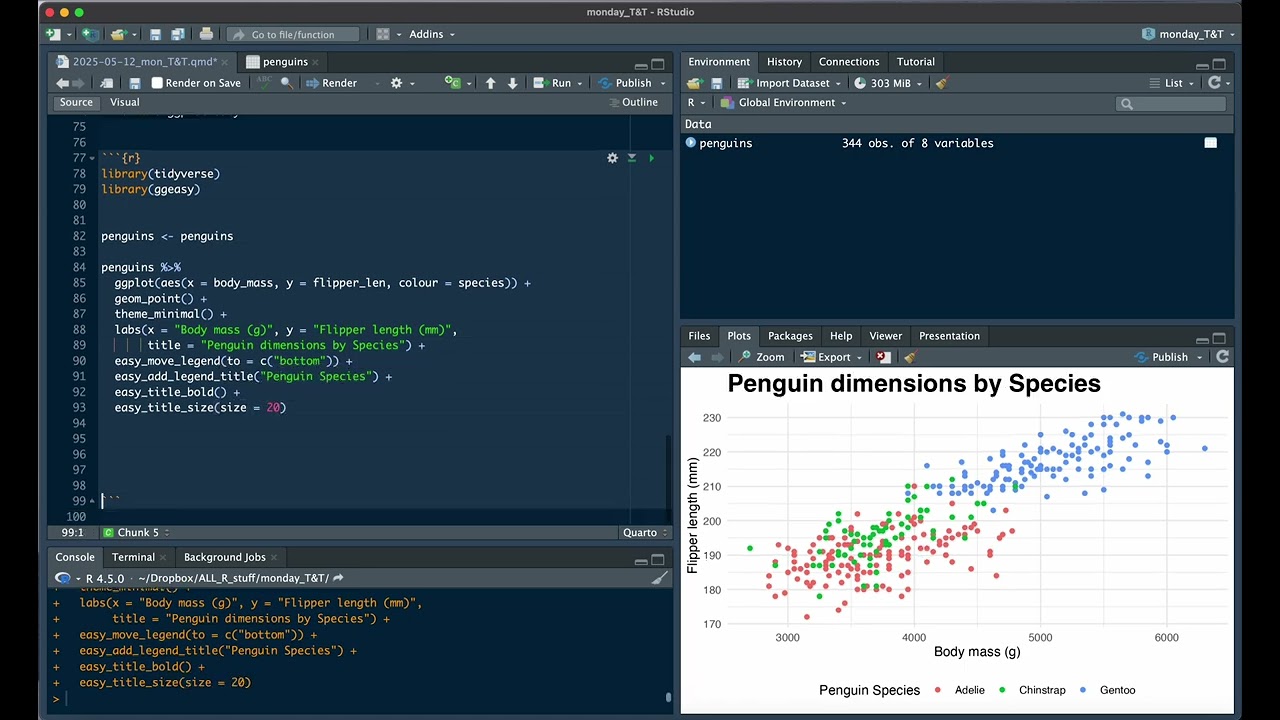](https://www.youtube.com/watch?v=PX8m69owHAs)
## Examples
```{r example}
library(ggplot2)
library(ggeasy)
# rotate x axis labels
ggplot(mtcars, aes(hp, mpg)) +
geom_point() +
easy_rotate_x_labels()
# rotate y axis labels
ggplot(mtcars, aes(hp, mpg)) +
geom_point() +
easy_rotate_y_labels()
# remove 'size' legend
ggplot(mtcars, aes(wt, mpg, colour = cyl, size = hp)) +
geom_point() +
easy_remove_legend(size)
# make the x axis labels larger
ggplot(mtcars, aes(mpg, hp)) +
geom_point() +
easy_x_axis_labels_size(22)
# make all the text red
ggplot(mtcars, aes(mpg, hp)) +
geom_point(aes(fill = gear)) +
easy_all_text_color("red")
# remove just x axis
ggplot(mtcars, aes(wt, mpg)) +
geom_point() +
easy_remove_x_axis()
# remove y axis ticks
ggplot(mtcars, aes(wt, mpg)) +
geom_point() +
easy_remove_y_axis(what = "ticks")
# move legends to bottom
ggplot(mtcars, aes(wt, mpg, colour = cyl, size = hp)) +
geom_point() +
easy_move_legend("bottom")
# move legend to left side
ggplot(mtcars, aes(wt, mpg, colour = cyl, size = hp)) +
geom_point() +
easy_legend_at("left")
# Make legends horizontal
ggplot(mtcars, aes(wt, mpg, colour = cyl, size = hp)) +
geom_point() + easy_rotate_legend("horizontal")
```
These functions will try to teach you the 'official' way to achieve these goal,
usually via the `teach` argument (where implemented)
```{r teach}
ggplot(mtcars, aes(hp, mpg)) +
geom_point() +
easy_rotate_y_labels(angle = "startatbottom", teach = TRUE)
ggplot(mtcars, aes(wt, mpg)) +
geom_point() +
easy_remove_y_axis(what = "ticks", teach = TRUE)
```
## Credits
Many thanks to [Sébastien Rochette (\@statnmap)](https://statnmap.com/) for
the design and execution of the hex logo.