https://github.com/jonpulsifer/dnsmon-go
A golang DNS monitor inspired by https://github.com/gamelinux/passivedns
https://github.com/jonpulsifer/dnsmon-go
dns golang gopacket monitoring prometheus security security-tools
Last synced: 10 months ago
JSON representation
A golang DNS monitor inspired by https://github.com/gamelinux/passivedns
- Host: GitHub
- URL: https://github.com/jonpulsifer/dnsmon-go
- Owner: jonpulsifer
- License: mit
- Created: 2017-06-24T20:13:07.000Z (about 9 years ago)
- Default Branch: main
- Last Pushed: 2025-08-10T13:26:09.000Z (11 months ago)
- Last Synced: 2025-08-10T15:31:35.901Z (11 months ago)
- Topics: dns, golang, gopacket, monitoring, prometheus, security, security-tools
- Language: Go
- Homepage:
- Size: 6.33 MB
- Stars: 30
- Watchers: 3
- Forks: 9
- Open Issues: 4
-
Metadata Files:
- Readme: README.md
- License: LICENSE
- Code of conduct: CODE_OF_CONDUCT.md
Awesome Lists containing this project
README
# dnsmon-go


[](https://goreportcard.com/report/github.com/jonpulsifer/dnsmon-go)
This is a little program I wrote inspired by [passivedns](https://github.com/gamelinux/passivedns)
It logs all DNS packets it sees on a given interface
Sample output on Windows:
```powershell
INFO[0000] Prometheus endpoint: http://0.0.0.0:8080/metrics
INFO[0000] No flags specified, using defaults interface="\Device\NPF_{2652E425-01C4-4EB5-AE0F-0DE011B69C61}" promiscuous=true snaplen=65536
INFO[0000] Listening on device: \Device\NPF_{2652E425-01C4-4EB5-AE0F-0DE011B69C61}
INFO[0003] QUERY class=IN dst=8.8.8.8 id=19712 name=pulsifer.dev opcode=Query rcode="No Error" src=192.168.2.21 type=A
INFO[0003] QUERY class=IN dst=192.168.2.21 id=19712 name=pulsifer.dev opcode=Query rcode="No Error" src=8.8.8.8 type=A
INFO[0003] ANSWER class=IN dst=192.168.2.21 id=19712 ip=192.30.252.153 name=pulsifer.dev opcode=Query rcode="No Error" src=8.8.8.8 type=A
INFO[0003] ANSWER class=IN dst=192.168.2.21 id=19712 ip=192.30.252.154 name=pulsifer.dev opcode=Query rcode="No Error" src=8.8.8.8 type=A
```
## Grafana
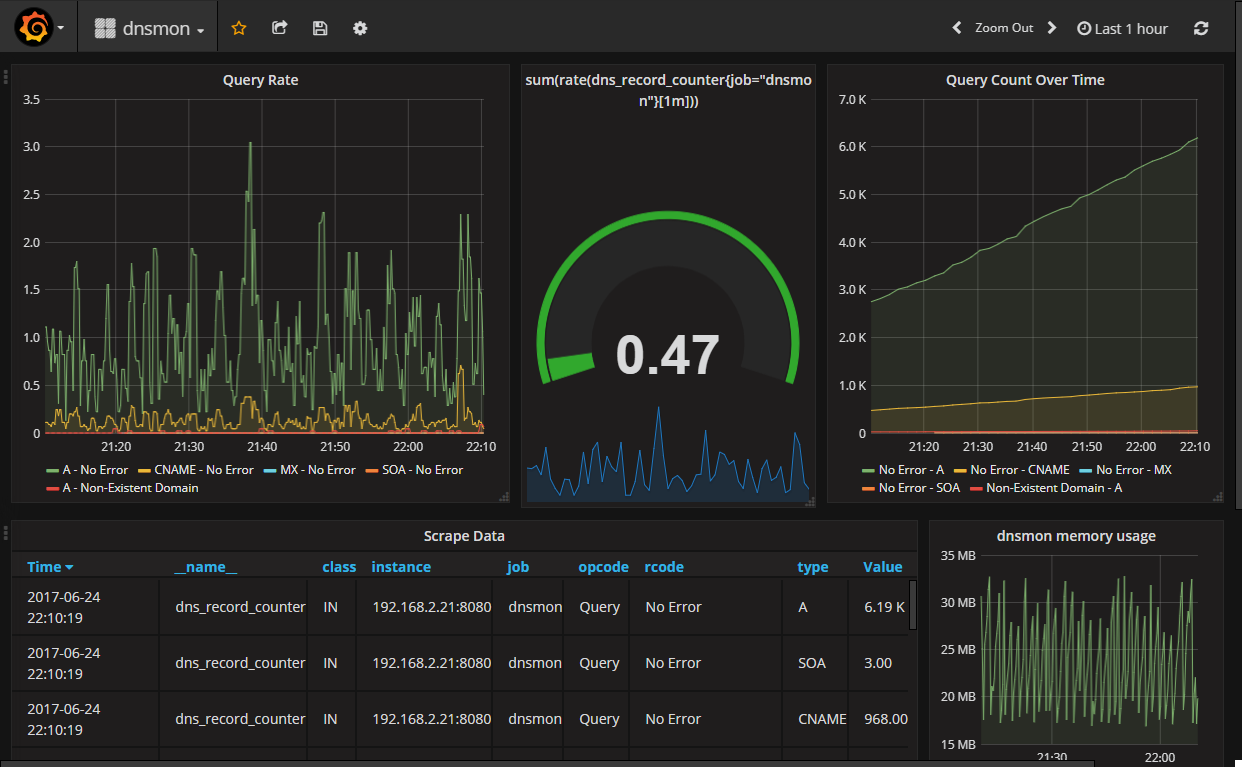
A dashboard has been included to get you started using `docker-compose`.
1. `docker-compose up`
2. Navigate to `localhost:3000` and log in to Grafana using `admin:admin`
3. Generate some DNS queries using `docker-compose exec dnsmon-go nslookup example.com`
4. Watch the dashboard go brr