https://github.com/jrfonseca/xdot.py
Interactive viewer for graphs written in Graphviz's dot language.
https://github.com/jrfonseca/xdot.py
graphviz gtk python xdot
Last synced: 6 months ago
JSON representation
Interactive viewer for graphs written in Graphviz's dot language.
- Host: GitHub
- URL: https://github.com/jrfonseca/xdot.py
- Owner: jrfonseca
- License: lgpl-3.0
- Created: 2013-05-12T09:59:58.000Z (over 12 years ago)
- Default Branch: main
- Last Pushed: 2025-03-29T16:30:06.000Z (8 months ago)
- Last Synced: 2025-04-05T09:02:37.391Z (8 months ago)
- Topics: graphviz, gtk, python, xdot
- Language: Python
- Size: 385 KB
- Stars: 888
- Watchers: 43
- Forks: 150
- Open Issues: 15
-
Metadata Files:
- Readme: README.md
- License: LICENSE.txt
Awesome Lists containing this project
- awesome-robotic-tooling - xdot - Interactive viewer for graphs written in Graphviz's dot language. (Data Visualization and Mission Control / Command Line Interface)
- awesome-gtk - xdot.py - Interactive viewer for graphs written in [Graphviz] `#python` `#gtk3`. (Graphics / Technical Graphics)
- starred-awesome - xdot.py - Interactive viewer for graphs written in Graphviz's dot language. (Python)
README
About _xdot.py_
=================
_xdot.py_ is an interactive viewer for graphs written in [Graphviz](http://www.graphviz.org/)'s [dot language](http://www.graphviz.org/doc/info/lang.html).
It uses internally the GraphViz's [xdot output format](http://www.graphviz.org/doc/info/output.html#d:xdot) as an intermediate format, [Python GTK bindings](https://pygobject.readthedocs.io), and [Cairo](https://cairographics.org/) for rendering.
_xdot.py_ can be used either as a standalone application from command line, or as a library embedded in your Python application.
Status
======
_xdot.py_ script became much more popular than I ever anticipated, and there are several interested in improving it further. However, for several years now, _xdot.py_ already meets my own needs, and unfortunately I don't have much time for maintaining it myself.
So I'm looking into transition _xdot.py_ maintenance to [others](https://github.com/jrfonseca/xdot.py/wiki/Forks): either hand over the maintenance _xdot.py_ to a community or indicate an official fork of _xdot.py_.
I encourage people interested in development of _xdot.py_ to fork the [GitHub repository](https://github.com/jrfonseca/xdot.py), and join the new [mailing list](https://groups.google.com/d/forum/xdot-py).
Features
========
* Since it doesn't use bitmaps it is fast and has a small memory footprint.
* Arbitrary zoom.
* Keyboard/mouse navigation.
* Supports events on the nodes with URLs.
* Animated jumping between nodes.
* Highlights node/edge under mouse.
Known Issues
============
* Not all xdot attributes are supported or correctly rendered yet. It works well for my applications but YMMV.
* Text doesn't scale properly to large sizes if font hinting is enabled. I haven't found a reliable way to disable font hinting during rendering yet.
See also:
* [github issue tracker](https://github.com/jrfonseca/xdot.py/issues)
Screenshots
===========
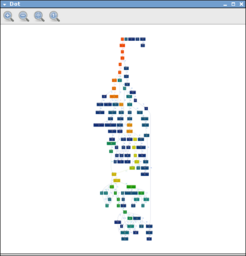
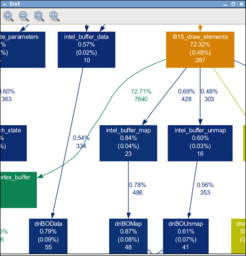
[](https://raw.github.com/wiki/jrfonseca/xdot.py/xdot-profile1.png)
[](https://raw.github.com/wiki/jrfonseca/xdot.py/xdot-profile2.png)
[](https://raw.github.com/wiki/jrfonseca/xdot.py/xdot-cfg.png)
Requirements
============
* [Python 3](https://www.python.org/download/)
* [PyGObject bindings for GTK3](https://pygobject.readthedocs.io)
* [NumPy](https://numpy.org/)
* [Graphviz](https://graphviz.org/download/)
Windows users
-------------
Download and install:
* [Python for Windows](https://www.python.org/downloads/windows/)
* [PyGObject bindings for GTK3](https://pygobject.readthedocs.io/en/latest/getting_started.html#windows-getting-started)
* `pip install numpy`
* [Graphviz for Windows](https://graphviz.org/download/)
Debian/Ubuntu users
-------------------
Run:
apt install gir1.2-gtk-3.0 python3-gi python3-gi-cairo python3-numpy graphviz
Usage
=====
Command Line
------------
If you install _xdot.py_ from PyPI or from your Linux distribution package managing system, you should have the `xdot` somewhere in your `PATH` automatically.
When running _xdot.py_ from its source tree, you can run it by first setting `PYTHONPATH` environment variable to the full path of _xdot.py_'s source tree, then running:
python3 -m xdot
You can also pass the following options:
Usage:
xdot.py [file|-]
Options:
-h, --help show this help message and exit
-f FILTER, --filter=FILTER
graphviz filter: dot, neato, twopi, circo, or fdp
[default: dot]
-n, --no-filter assume input is already filtered into xdot format (use
e.g. dot -Txdot)
-g GEOMETRY default window size in form WxH
Shortcuts:
Up, Down, Left, Right scroll
PageUp, +, = zoom in
PageDown, - zoom out
R reload dot file
F find
Q quit
P print
T toggle toolbar
W zoom to fit
Escape halt animation
Ctrl-drag zoom in/out
Shift-drag zooms an area
Click (on edge) focus edge's source node
Ctrl-click (on edge) focus edge's *destination* node
If `-` is given as input file then _xdot.py_ will read the dot graph from the standard input.
Embedding
---------
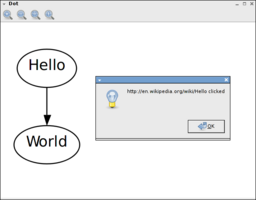
See included `sample.py` script for an example of how to embedded _xdot.py_ into another application.
[](https://raw.github.com/wiki/jrfonseca/xdot.py/xdot-sample.png)
Download
========
* https://pypi.python.org/pypi/xdot
* https://github.com/jrfonseca/xdot.py
Links
=====
* [Graphviz homepage](http://www.graphviz.org/)
* [ZGRViewer](http://zvtm.sourceforge.net/zgrviewer.html) -- another superb graphviz/dot viewer
* [dot2tex](https://github.com/kjellmf/dot2tex) -- python script to convert xdot output from Graphviz to a series of PSTricks or PGF/TikZ commands.
* The [PyPy project](http://pypy.org/) also includes an [interactive dot viewer based on graphviz's plain format and the pygame library](https://morepypy.blogspot.com/2008/01/visualizing-python-tokenizer.html).