https://github.com/jsf0/chartctl
A declarative flowchart maker for the command line
https://github.com/jsf0/chartctl
flowchart
Last synced: about 1 year ago
JSON representation
A declarative flowchart maker for the command line
- Host: GitHub
- URL: https://github.com/jsf0/chartctl
- Owner: jsf0
- License: bsd-3-clause
- Created: 2024-10-16T23:16:54.000Z (over 1 year ago)
- Default Branch: main
- Last Pushed: 2024-10-17T01:00:51.000Z (over 1 year ago)
- Last Synced: 2025-01-24T02:58:57.362Z (over 1 year ago)
- Topics: flowchart
- Language: Python
- Homepage: http://kernelpanic.life/software/declarative-flowchart-making.html
- Size: 9.77 KB
- Stars: 0
- Watchers: 1
- Forks: 0
- Open Issues: 0
-
Metadata Files:
- Readme: README.md
- License: LICENSE
Awesome Lists containing this project
README
# chartctl
This is a Python command-line tool that generates flowcharts based on a JSON configuration file, and outputs them as a PNG.
## Requirements
- `graphviz` Python package (`pip install graphviz`)
- Graphviz binary (for the `dot` command)
## Installation
1. Clone this repository or download the script:
```bash
git clone https://github.com/jsf0/chartctl.git
cd chartctl
```
2. Install the required Python package:
```bash
pip install graphviz
```
## Usage
### Command-Line Options
- `-i, --input` (required): Path to the JSON configuration file.
- `-o, --output` (optional): Path to save the output PNG file (without the PNG extension). Defaults to `flowchart.png`.
### Examples
Here's a simple config file:
```
{
"nodes": {
"start": { "label": "Start Process" },
"approval": { "label": "Request Approval" },
"approved": { "label": "Approved" },
"rejected": { "label": "Rejected" },
"retry": { "label": "Retry Request" },
"end": { "label": "End Process" }
},
"connectors": [
{ "from": "start", "to": "approval" },
{ "from": "approval", "to": "approved", "label": "Yes" },
{ "from": "approval", "to": "rejected", "label": "No" },
{ "from": "rejected", "to": "retry", "label": "Retry?" },
{ "from": "retry", "to": "approval" },
{ "from": "approved", "to": "end" }
]
}
```
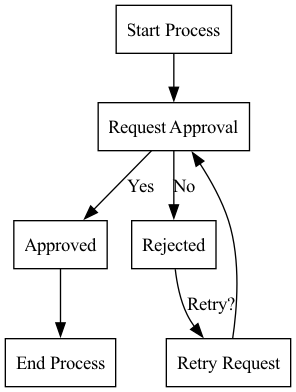
"Nodes" are the start/end blocks, processes, decision points, or anything else you want in your flowchart. "Connectors" are the lines that connect them together. You can label nodes and connectors however you want.
You can create the PNG out of the JSON above with the following command:
```bash
chartctl.py -i request_process.json
```
It will create the following PNG:
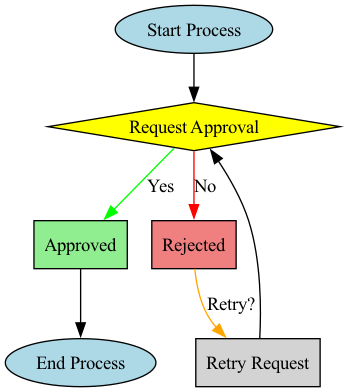
You can optionally add colors and custom shapes for the nodes and connectors too:
```
{
"nodes": {
"start": { "label": "Start Process", "shape": "oval", "fillcolor": "lightblue", "style": "filled" },
"approval": { "label": "Request Approval", "shape": "diamond", "fillcolor": "yellow", "style": "filled" },
"approved": { "label": "Approved", "shape": "rectangle", "fillcolor": "lightgreen", "style": "filled" },
"rejected": { "label": "Rejected", "shape": "rectangle", "fillcolor": "lightcoral", "style": "filled" },
"retry": { "label": "Retry Request", "shape": "rectangle", "fillcolor": "lightgray", "style": "filled" },
"end": { "label": "End Process", "shape": "oval", "fillcolor": "lightblue", "style": "filled" }
},
"connectors": [
{ "from": "start", "to": "approval" },
{ "from": "approval", "to": "approved", "label": "Yes", "color": "green" },
{ "from": "approval", "to": "rejected", "label": "No", "color": "red" },
{ "from": "rejected", "to": "retry", "label": "Retry?", "color": "orange" },
{ "from": "retry", "to": "approval" },
{ "from": "approved", "to": "end" }
]
}
```
This will generate a more colorful flowchart: