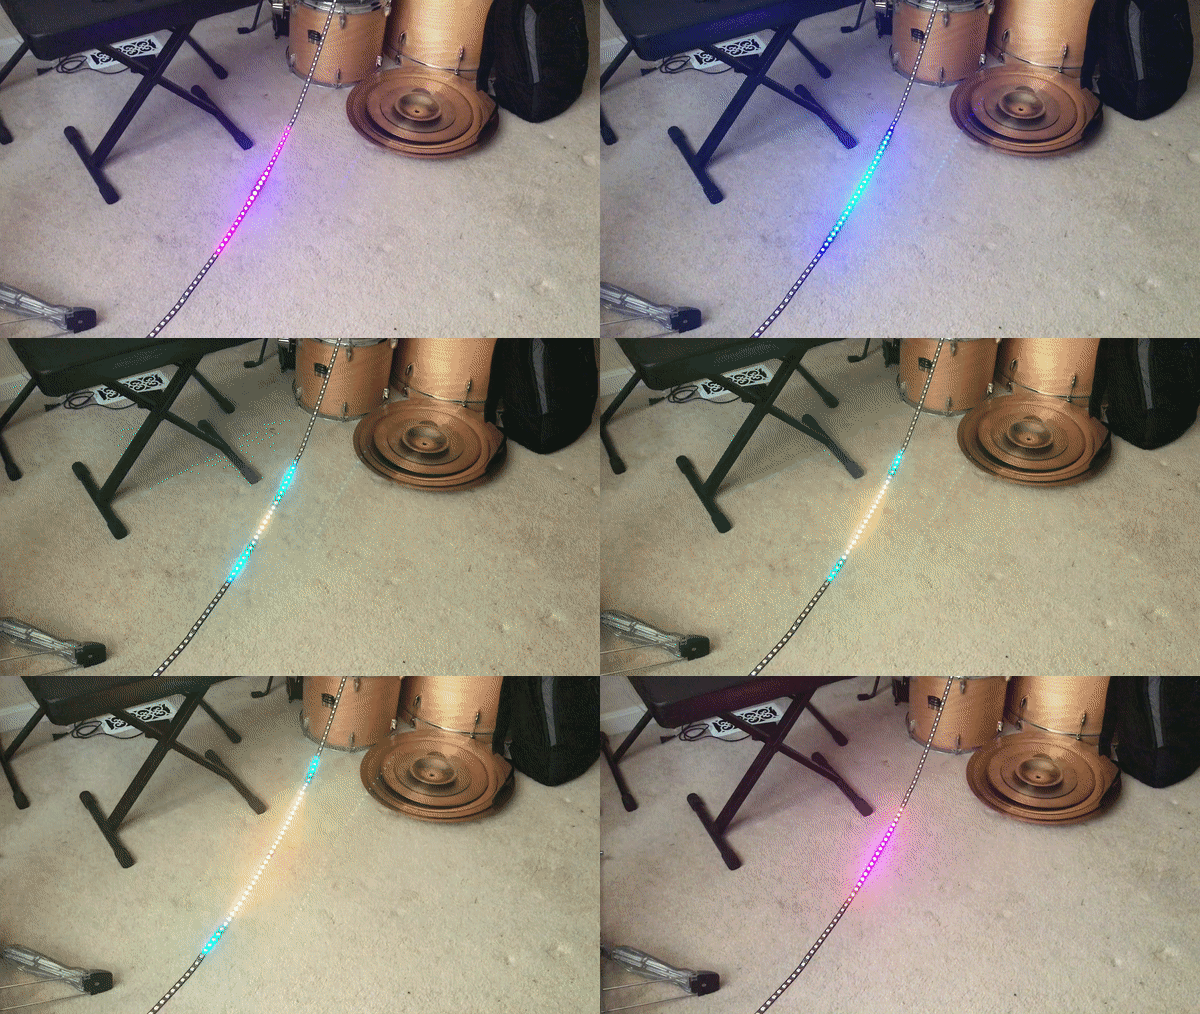
https://github.com/justcallmekoko/musicvisualizer
A music visualizer based on the ATMEGA328P-AU
https://github.com/justcallmekoko/musicvisualizer
adafruit arduino atmega328p audio-analysis audio-processing audio-visualizer c-plus-plus ch340 msgeq7 music rgb-led spectrum-analyzer ws2812b
Last synced: 9 months ago
JSON representation
A music visualizer based on the ATMEGA328P-AU
- Host: GitHub
- URL: https://github.com/justcallmekoko/musicvisualizer
- Owner: justcallmekoko
- License: mit
- Created: 2020-02-18T22:27:30.000Z (almost 6 years ago)
- Default Branch: master
- Last Pushed: 2022-01-18T19:51:46.000Z (almost 4 years ago)
- Last Synced: 2025-02-28T10:58:45.220Z (10 months ago)
- Topics: adafruit, arduino, atmega328p, audio-analysis, audio-processing, audio-visualizer, c-plus-plus, ch340, msgeq7, music, rgb-led, spectrum-analyzer, ws2812b
- Language: C++
- Homepage:
- Size: 67.3 MB
- Stars: 44
- Watchers: 2
- Forks: 11
- Open Issues: 4
-
Metadata Files:
- Readme: README.md
- License: LICENSE
Awesome Lists containing this project
README
          # Music Visualizer


  Instagram

  - YouTube


  A music visualizer based on the ATMEGA328P-AU.


# Table of Cadence

- [Intro](#intro)

- [Installation](#installation)

- [Usage](#usage)

  - [Cycle Button](#cycle-button)

  - [Reset Button](#reset-button)

  - [Up Button and Down Button](#up-button-and-down-button)

# Intro

*Oh god, how did it come to this?*

A while back I had published a [project](https://github.com/justcallmekoko/Arduino-FastLED-Music-Visualizer) detailing the process for creating your own music visualizer using an Arduino Uno and a [Sparkfun Spectrum Shield](https://www.sparkfun.com/products/13116). I love Sparkfun and I love Arduino, but I also love making things as simple and intuitive as possible. For these reasons, I have designed the Arduino compatible Music Visualizer based on the ATmega328p-au. It is the single board version of the original Arduino Music Visualizer from my previous project with a few other changes. Rather than using the [FastLED](https://github.com/FastLED/FastLED) library, I have employed the [Adafruit NeoPixel](https://github.com/adafruit/Adafruit_NeoPixel) library which made for some more simple code in the end. I have opted for the surface mount version of the ATmega328p for a more compact package. There is no need for any soldering or jumper wires as the connections between the spectrum analyzer, arduino, and RGB strip are already included on the board. Pretty much this project is as plug and play as possible.

# Installation

The music visualizer is meant to sit between the music source such as your phone or computer and the output speakers. For best outcome, I typically increase the volume of my music source to 100% while adjusting the volume on my speakers to the desired output volume. This will allow the visualizer to process a greater range of audio level intensities.

1. Connect a 3.5mm jack from your music source to the `IN` port of the visualizer

2. Connect another 3.5mm jack from the `OUT` port of the visualizer to the output spearkers of your choice

3. Connect a strip of [WS2812B RG LEDs](https://www.amazon.com/Aclorol-Individually-Addressable-Programmable-Non-waterproof/dp/B07BH37JGC/ref=sr_1_3_sspa?crid=V8OKKGN5OVGO&keywords=ws2812b+led+strip&qid=1582556868&s=hi&sprefix=ws2812b%2Ctools%2C188&sr=1-3-spons&psc=1&spLa=ZW5jcnlwdGVkUXVhbGlmaWVyPUFHTkw1TlM2Tzc0VE0mZW5jcnlwdGVkSWQ9QTA5NjQ1NDMzOTlETzlMVDFJNTJKJmVuY3J5cHRlZEFkSWQ9QTA5MDQ3OThHMUpFQVpXR0VKTDUmd2lkZ2V0TmFtZT1zcF9hdGYmYWN0aW9uPWNsaWNrUmVkaXJlY3QmZG9Ob3RMb2dDbGljaz10cnVl) no greater than 255 LEDs in length to the JST connector extending from the side of the visualizer

4. Power the visualizer using a Micro USB cable connected to a 5v power source

# Usage

Because markings on the board are different from the markings I designed on the enclosure, I will place a translation key here and I will be using the markings on the board to refer to the different buttons available to you as the user.

| Enclosure | Board |

| --------- | ----- |

| C         | Cycle |

| R         | Reset |

| +         | Up    |

| -         | Down  |

### Cycle Button

The Cycle Button can be used to cycle through the available patterns preprogrammed onto the visuazlier. Press the Cycle Button once to advance to the next pattern. Once the last pattern is reached, pressing the Cycle Button once more will return to the first pattern in the array. The following is a list of the current available patterns.

- Single Level: A single equalizer bar reactive to bass frequencies

- Double Level: A center mirrored equalizer bar reactive to bass frequencies

- Tracer Level: Bass frequencies of a certain intensity threshold are translated into LED tracers fired across the strip

- Double Tracer Level: Bass frequencies of a certain intensity threshold are translated into LED tracers fired from center to either end of the strip

- Active LEDs: Adjust the amount of LEDs the visualizer will use

### Reset Button

The Reset Button will hard reset the visualizer. The will cause the visualizer to reboot and load the user settings saved in EEPROM

### Up Button and Down Button

The Up Button will have different functionality depending on the current mode

#### Single Level

The Up and Down Buttons will adjust the intensity of the LED reaction for this mode

#### Double Level

Like in Single Level, the Up and Down Buttons will adjust the intensity of the LED reaction for this mode

#### Tracer and Double Tracer

The Up and Down Buttons will adjust the audio threshold that causes the LEDs to react. The lower the threshold, the low the intensity of the music required to make the LEDs react. The Up and Down Buttons in this context have a hold functionality. A single press will adjust the threshold by 1. Holding the button for longer than a half second will adjust the threshold by 1 for every processor cycle while the button is held.

#### Active LEDs

The Up and Down Buttons will adjust the amount of LEDs the visualizer will use for its effects. Because the number of LEDs in a strip cannot be determined dynamically in this configuration while strip size can change based on user discretion, you may be required to adjust the number of LEDs the visualizer "knows about". If you have a strip of 100 LEDs, you will need to adjust the number of `Active LEDs` to 100 using the Up or Down Buttons. The current number of Active LEDs is shown by lighting only the active LEDs in Red. If you fail to adjust the number of `Active LEDs` in the visualizer settings to the number of LEDs actually in your strip, the effects may not display properly on your strip i.e. overreactive or underreactive visual effects.