https://github.com/jwasilgeo/esri-experiments
Fly in space and look across the sea: demos and experiments with the ArcGIS API for JavaScript
https://github.com/jwasilgeo/esri-experiments
antipodes arcgis-js-api esri esri-js geography geovisualization javascript mapping webmaps
Last synced: 6 months ago
JSON representation
Fly in space and look across the sea: demos and experiments with the ArcGIS API for JavaScript
- Host: GitHub
- URL: https://github.com/jwasilgeo/esri-experiments
- Owner: jwasilgeo
- Created: 2016-03-26T17:26:11.000Z (over 10 years ago)
- Default Branch: master
- Last Pushed: 2025-06-12T15:15:30.000Z (about 1 year ago)
- Last Synced: 2025-06-12T16:29:36.246Z (about 1 year ago)
- Topics: antipodes, arcgis-js-api, esri, esri-js, geography, geovisualization, javascript, mapping, webmaps
- Language: HTML
- Homepage: https://jwasilgeo.github.io/esri-experiments
- Size: 40.9 MB
- Stars: 35
- Watchers: 5
- Forks: 5
- Open Issues: 0
-
Metadata Files:
- Readme: README.md
Awesome Lists containing this project
README
# esri-experiments
Web mapping experiments using the [ArcGIS API for JavaScript](https://js.arcgis.com).
Also check out my [LeafletJS experiments](https://github.com/jwasilgeo/leaflet-experiments) and other data visualizations on [CodePen](https://codepen.io/jwasilgeo/).
## Table of Contents
- [earth-at-night](#earth-at-night)
- [antipodes](#antipodes)
- [antipodes-2d](#antipodes-2d)
- [around-the-world](#around-the-world)
- [custom-point-layer](#custom-point-layer)
- [custom-tile-layer](#custom-tile-layer)
- [scene-view-as-chart](#scene-view-as-chart)
- [iss-view](#iss-view)
## [earth-at-night](https://jwasilgeo.github.io/esri-experiments/earth-at-night)
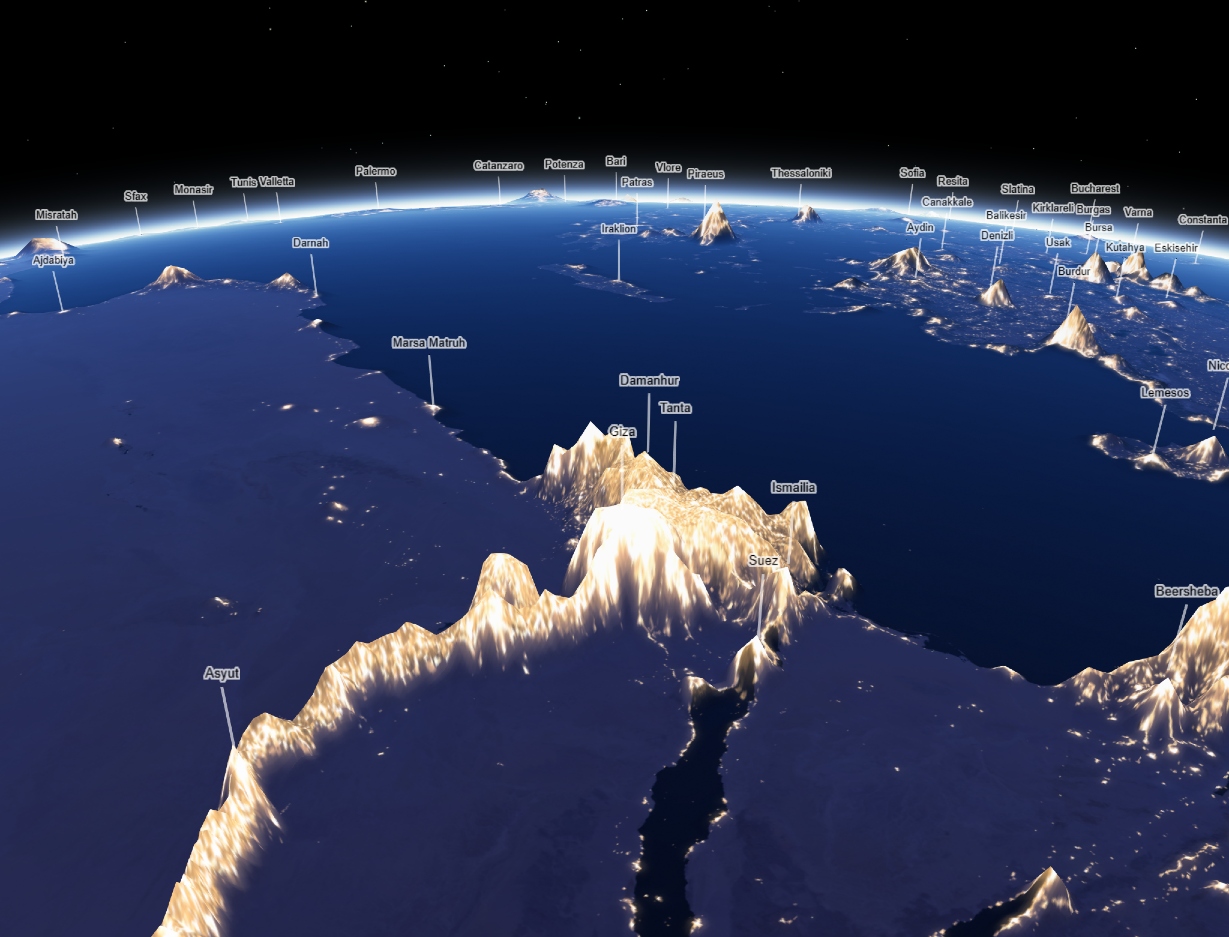
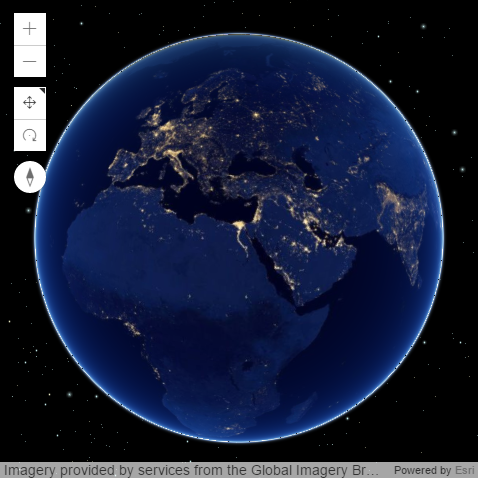
"Earth at Night, Mountains of Light"
🏆 **KANTAR Information is Beautiful Awards 2019**: [GOLD winner in "Maps, Places & Spaces" category](https://www.informationisbeautifulawards.com/news/497-the-winners-maps-places-spaces)
Explore the Earth at night as seen by Suomi NPP VIIRS. Light emissions are used as the world's thematic elevation layer by using [chroma.js](https://gka.github.io/chroma.js/) to calculate pixel color luminance.
[](https://jwasilgeo.github.io/esri-experiments/earth-at-night)
[](https://jwasilgeo.github.io/esri-experiments/earth-at-night)
## [antipodes](https://jwasilgeo.github.io/esri-experiments/antipodes)
Get to know the opposite side of the Earth in 3D.
[](https://jwasilgeo.github.io/esri-experiments/antipodes)
## [antipodes-2d](https://jwasilgeo.github.io/esri-experiments/antipodes-2d)
Get to know the opposite side of the Earth in 2D. Includes several color scheme choices for colorblind support.
[](https://jwasilgeo.github.io/esri-experiments/antipodes-2d)
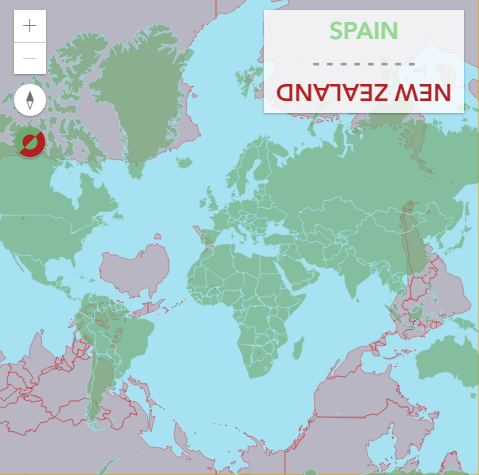
## [around-the-world](https://jwasilgeo.github.io/esri-experiments/around-the-world)
Find out what lies across the ocean and beyond by traveling around the Earth, and along the way learn how geodesic lines appear on globes vs. 2D web mercator maps.
[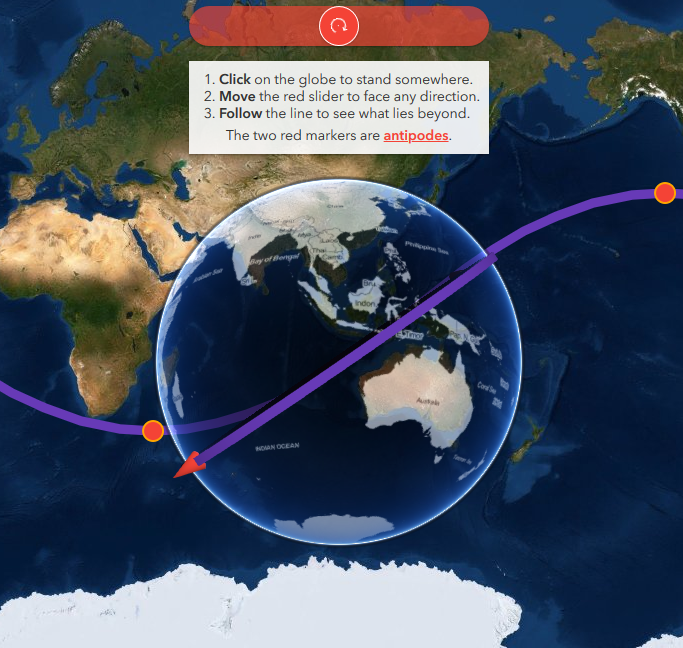](https://jwasilgeo.github.io/esri-experiments/around-the-world)
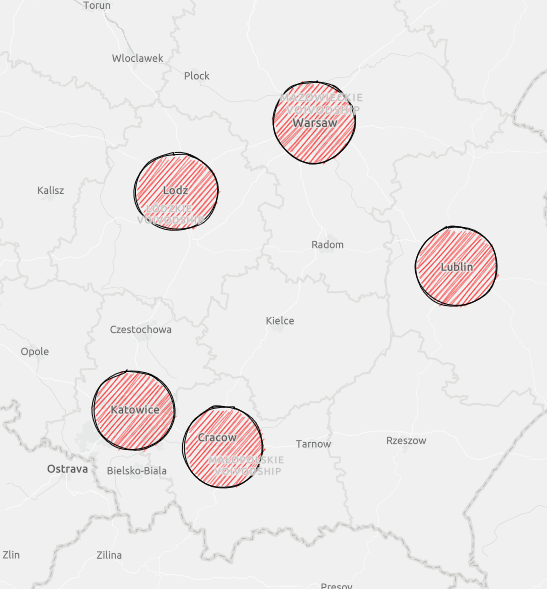
## [custom-point-layer](https://jwasilgeo.github.io/esri-experiments/custom-point-layer/3-animate-custom-layer-with-animejs.html)
Find out how to build your own 2D layer with the [Canvas API](https://developer.mozilla.org/en-US/docs/Web/API/Canvas_API) and animate it the help of [Anime.js](https://animejs.com/), or alternatively with [Tween.js](https://github.com/tweenjs/tween.js).
You can also use canvas helpers from [D3.js](https://d3js.org/) to make donuts charts, draw sketchy looking graphics with [Rough.js](https://github.com/pshihn/rough), and anything else you can dream of.
[Radius animation example with Anime.js](https://jwasilgeo.github.io/esri-experiments/custom-point-layer/3-animate-custom-layer-with-animejs.html)
[Radius animation example with Tween.js](https://jwasilgeo.github.io/esri-experiments/custom-point-layer/3-animate-custom-layer-with-tweenjs.html)
[Pie/donuts charts example with D3js](https://jwasilgeo.github.io/esri-experiments/custom-point-layer/d3-pies-layer.html)
[_Sketchy_ example with Rough.js](https://jwasilgeo.github.io/esri-experiments/custom-point-layer/rough-layer.html)
[](https://jwasilgeo.github.io/esri-experiments/custom-point-layer/3-animate-custom-layer-with-animejs.html)
[](https://jwasilgeo.github.io/esri-experiments/custom-point-layer/d3-pies-layer.html)
[](https://jwasilgeo.github.io/esri-experiments/custom-point-layer/rough-layer.html)
## custom-tile-layer
Find out how to build your own tiled layer in either 2D or 3D with the [Canvas API](https://developer.mozilla.org/en-US/docs/Web/API/Canvas_API).
[Example showing level, row, and column info](https://jwasilgeo.github.io/esri-experiments/custom-tile-layer/custom-tile-layer.html)
[Example with kittens! 😻 🐈](https://jwasilgeo.github.io/esri-experiments/custom-tile-layer/custom-kittens-layer.html)
[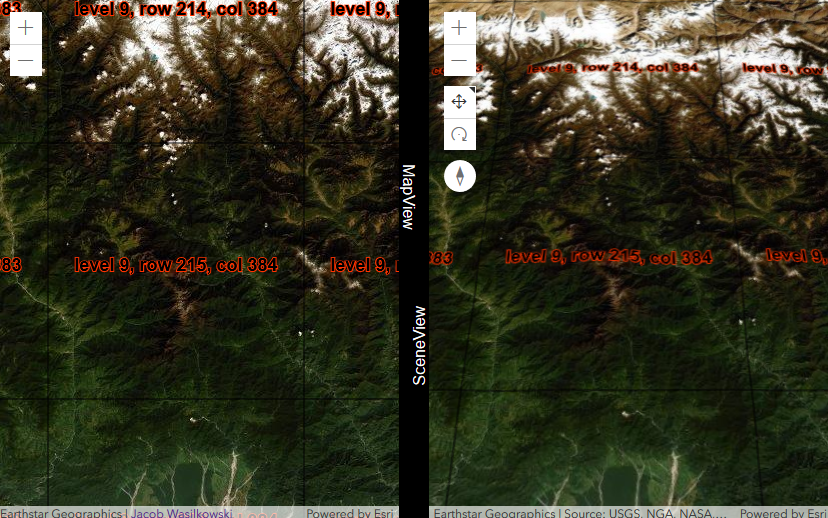](https://jwasilgeo.github.io/esri-experiments/custom-tile-layer/custom-tile-layer.html)
[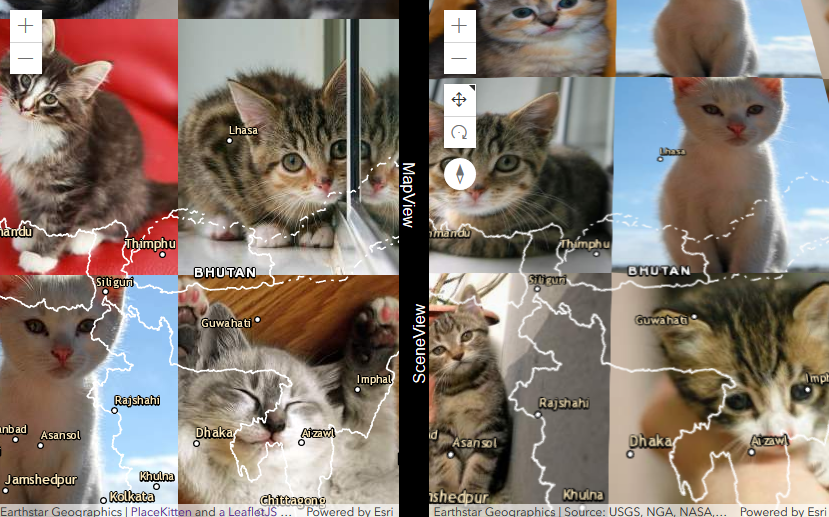](https://jwasilgeo.github.io/esri-experiments/custom-tile-layer/custom-kittens-layer.html)
## [scene-view-as-chart](https://jwasilgeo.github.io/esri-experiments/scene-view-as-chart)
You've always wanted to turn a `SceneView` into your own 3D scatterplot charting library. Here you go.
[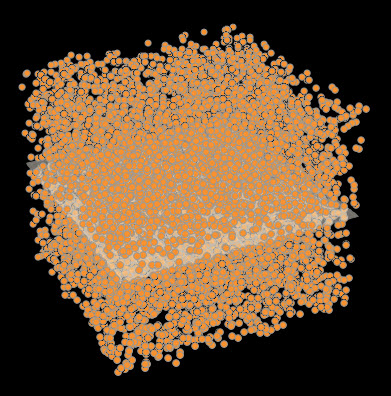](https://jwasilgeo.github.io/esri-experiments/scene-view-as-chart)
## [iss-view](https://jwasilgeo.github.io/esri-experiments/iss-view)
Take a ride on the International Space Station and explore NASA astronaut photography.
[](https://jwasilgeo.github.io/esri-experiments/iss-view)