https://github.com/jwasilgeo/leaflet-experiments
Demos and experiments with LeafletJS
https://github.com/jwasilgeo/leaflet-experiments
aviation flight leafletjs mapping
Last synced: 6 months ago
JSON representation
Demos and experiments with LeafletJS
- Host: GitHub
- URL: https://github.com/jwasilgeo/leaflet-experiments
- Owner: jwasilgeo
- License: mit
- Created: 2017-08-10T13:01:20.000Z (almost 9 years ago)
- Default Branch: master
- Last Pushed: 2022-02-11T00:50:39.000Z (over 4 years ago)
- Last Synced: 2024-10-28T04:25:43.271Z (over 1 year ago)
- Topics: aviation, flight, leafletjs, mapping
- Language: JavaScript
- Size: 1.29 MB
- Stars: 26
- Watchers: 3
- Forks: 8
- Open Issues: 0
-
Metadata Files:
- Readme: README.md
- License: LICENSE.md
Awesome Lists containing this project
README
# leaflet-experiments
Web mapping experiments using [LeafletJS](https://leafletjs.com/).
Also check out my [Esri experiments](https://github.com/jwasilgeo/esri-experiments) and other data visualizations on [CodePen](https://codepen.io/jwasilgeo/).
## [Aviation Tracker](https://jwasilgeo.github.io/leaflet-experiments/aviation/)
### Read more about it at [**FlowingData: Aviation tracker with depth**](https://flowingdata.com/2017/09/15/aviation-tracker-with-depth/)
[](https://jwasilgeo.github.io/leaflet-experiments/aviation/)
- Aircraft tracking data provided by **The OpenSky Network, **
- [Leaflet.ParallaxMarker (jwasilgeo fork)](https://github.com/jwasilgeo/Leaflet.ParallaxMarker): parallax layer originating from [@dagjomar's](https://github.com/dagjomar) awesome [Leaflet.ParallaxMarker](https://github.com/dagjomar/Leaflet.ParallaxMarker)
- [Leaflet.Terminator](https://github.com/joergdietrich/Leaflet.Terminator): solar terminator layer
- [Esri Leaflet](https://esri.github.io/esri-leaflet/): Esri gray basemap layer and geocoder widget
- [Font Awesome](https://fontawesome.com/): "plane" icon used for the parallax layer symbol
## [Night and Day](https://jwasilgeo.github.io/leaflet-experiments/night-and-day/)
[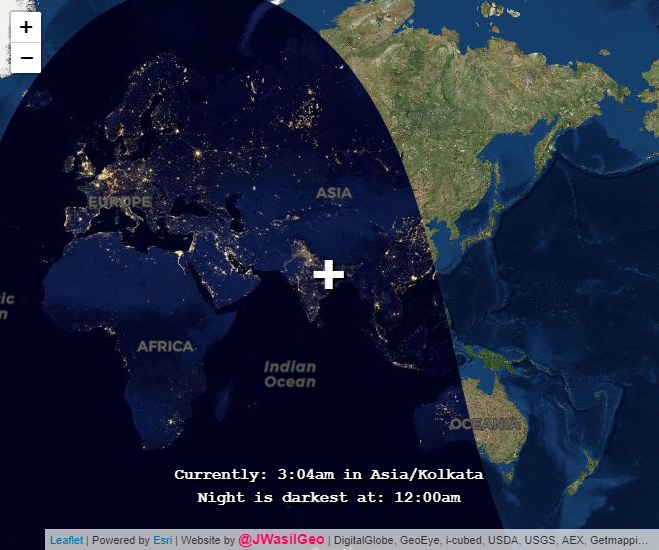](https://jwasilgeo.github.io/leaflet-experiments/night-and-day/)
- The Suomi-NPP VIIRS "Earth at Night" layer is clipped by using [Leaflet.Terminator](https://github.com/joergdietrich/Leaflet.Terminator) in combination with [TileLayer.BoundaryCanvas](https://github.com/aparshin/leaflet-boundary-canvas).
- [SunCalc](https://github.com/mourner/suncalc), [Turf.js](http://turfjs.org/), [spacetime](https://spencermountain.github.io/spacetime/), and [spacetime-geo](https://spencermountain.github.io/spacetime/) are used for reporting the local time and sun positions.
## [Lerc Imagery Land Cover Layer](https://jwasilgeo.github.io/leaflet-experiments/lerc-landcover/)
[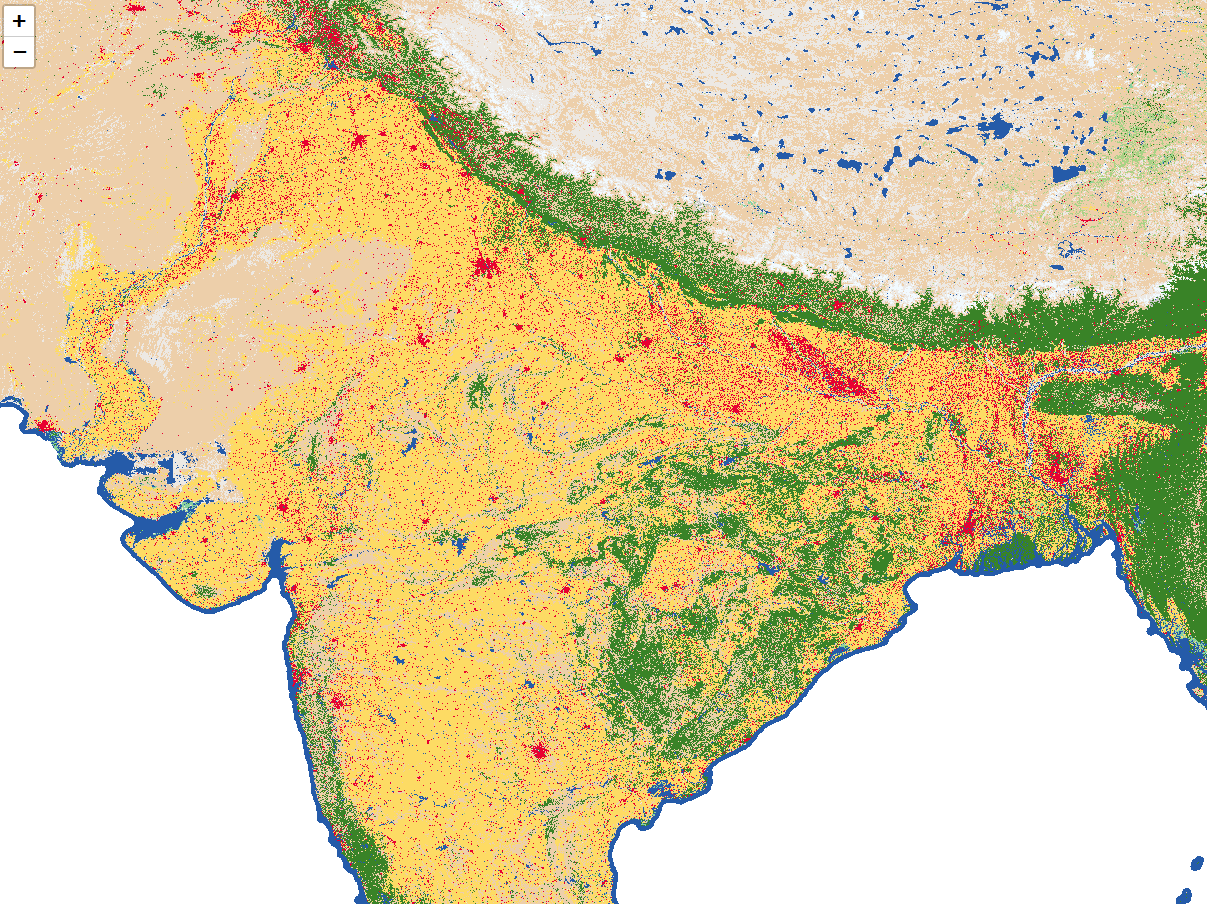](https://jwasilgeo.github.io/leaflet-experiments/lerc-landcover/)
- Demonstration of rendering a [2020 global land cover map](https://www.arcgis.com/home/item.html?id=d6642f8a4f6d4685a24ae2dc0c73d4ac) (produced by Impact Observatory for Esri) hosted as an ArcGIS ImageServer in tiled LERC format as 8bit color-coded pixels.
- **Inspired heavily by [@jgravois's](https://github.com/jgravois)** earlier research on tying together LERC decoding within a LeafletJS `GridLayer`.
- LERC imagery tile data are read with Esri's [Limited Error Raster Compression](https://github.com/Esri/lerc/) JavaScript decoder.
- Check out this [Esri Community thread](https://community.esri.com/t5/esri-leaflet-questions/how-to-diagnose-error-rendering-esri-2020-land/m-p/1079790) and [GitHub `esri-leaflet` discussion](https://github.com/Esri/esri-leaflet/issues/726) for more info.
## [Esri-Leaflet and Chart.js](https://developers.arcgis.com/esri-leaflet/samples/dynamic-chart/)
> Plot feature attributes on a dynamic chart that updates as users pan and zoom, and respond to chart interactions by modifying feature layer contents.
[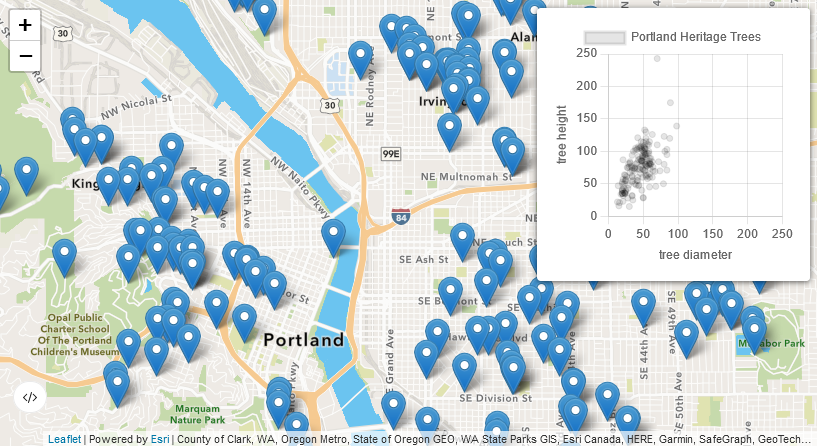](https://developers.arcgis.com/esri-leaflet/samples/dynamic-chart/)
## Licensing
A copy of the license is available in the repository's [LICENSE](./LICENSE.md) file.