https://github.com/k8spacket/node-graph-plugin
Datasource plugin to visualize data as Node graph panel for Grafana
https://github.com/k8spacket/node-graph-plugin
grafana nodegraph observability visualization
Last synced: 5 months ago
JSON representation
Datasource plugin to visualize data as Node graph panel for Grafana
- Host: GitHub
- URL: https://github.com/k8spacket/node-graph-plugin
- Owner: k8spacket
- License: apache-2.0
- Created: 2022-03-20T19:35:09.000Z (about 4 years ago)
- Default Branch: master
- Last Pushed: 2022-09-14T08:32:31.000Z (over 3 years ago)
- Last Synced: 2025-07-20T16:02:16.302Z (9 months ago)
- Topics: grafana, nodegraph, observability, visualization
- Language: TypeScript
- Homepage:
- Size: 725 KB
- Stars: 6
- Watchers: 2
- Forks: 0
- Open Issues: 0
-
Metadata Files:
- Readme: README.md
- Changelog: CHANGELOG.md
- License: LICENSE
Awesome Lists containing this project
README
# Node graph Grafana Datasource Plugin
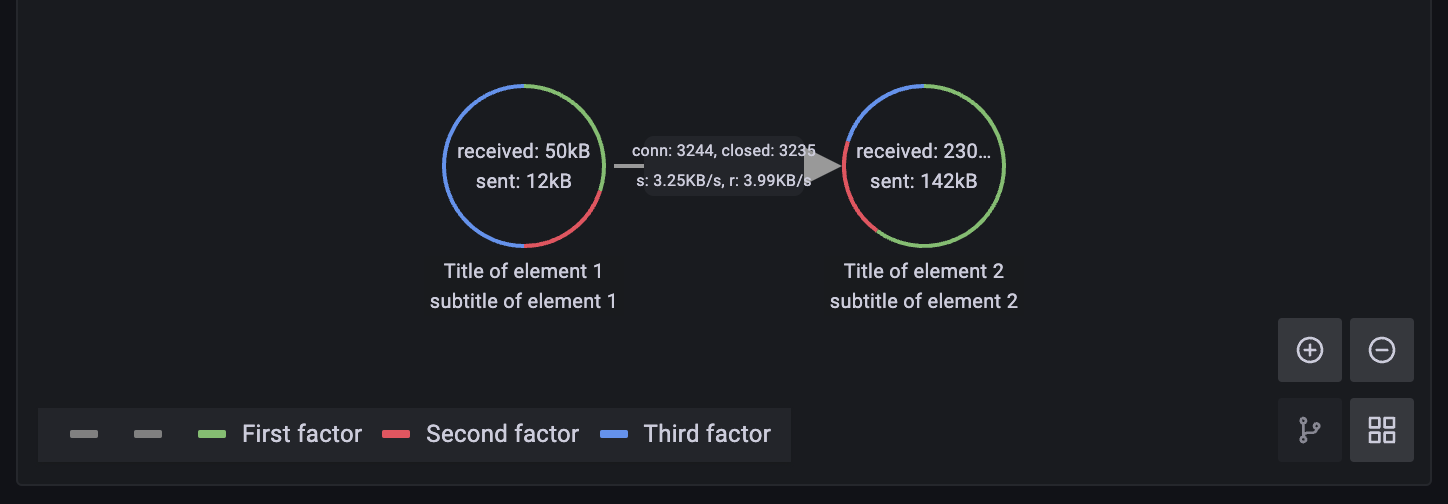
Datasource plugin to visualize data as Node graph panel for Grafana (https://grafana.com/docs/grafana/latest/visualizations/node-graph/)

## Required JSON format
```json
{
"config":{
"arc__1":{
"displayName":"First factor",
"color":"green"
},
"arc__2":{
"displayName":"Second factor",
"color":"red"
},
"arc__3":{
"displayName":"Third factor",
"color":"blue"
},
"mainStat": {
"displayName": " ",
"color": ""
},
"secondaryStat": {
"displayName": " ",
"color": ""
}
},
"nodes":[
{
"id":"id1",
"title":"Title of element 1",
"subTitle":"subtitle of element 1",
"mainStat":"received: 50kB",
"secondaryStat":"sent: 12kB",
"arc__1":0.3,
"arc__2":0.2,
"arc__3":0.5
},
{
"id":"id2",
"title":"Title of element 2",
"subTitle":"subtitle of element 2",
"mainStat":"received: 230MB",
"secondaryStat":"sent: 142kB",
"arc__1":0.6,
"arc__2":0.2,
"arc__3":0.2
}
],
"edges":[
{
"id":"id1-id2",
"source":"id1",
"target":"id2",
"mainStat":"conn: 3244, closed: 3235",
"secondaryStat":"s: 3.25KB/s, r: 3.99KB/s"
}
]
}
```
- nodes and edges correspond with nodes and edges in the Node graph panel
- config defines colors on circles and legend on panel
## Getting started
### Configuration
To install the plugin see the example for [loki-stack](https://github.com/k8spacket/node-graph-plugin/blob/master/examples/loki-stack/README.md)
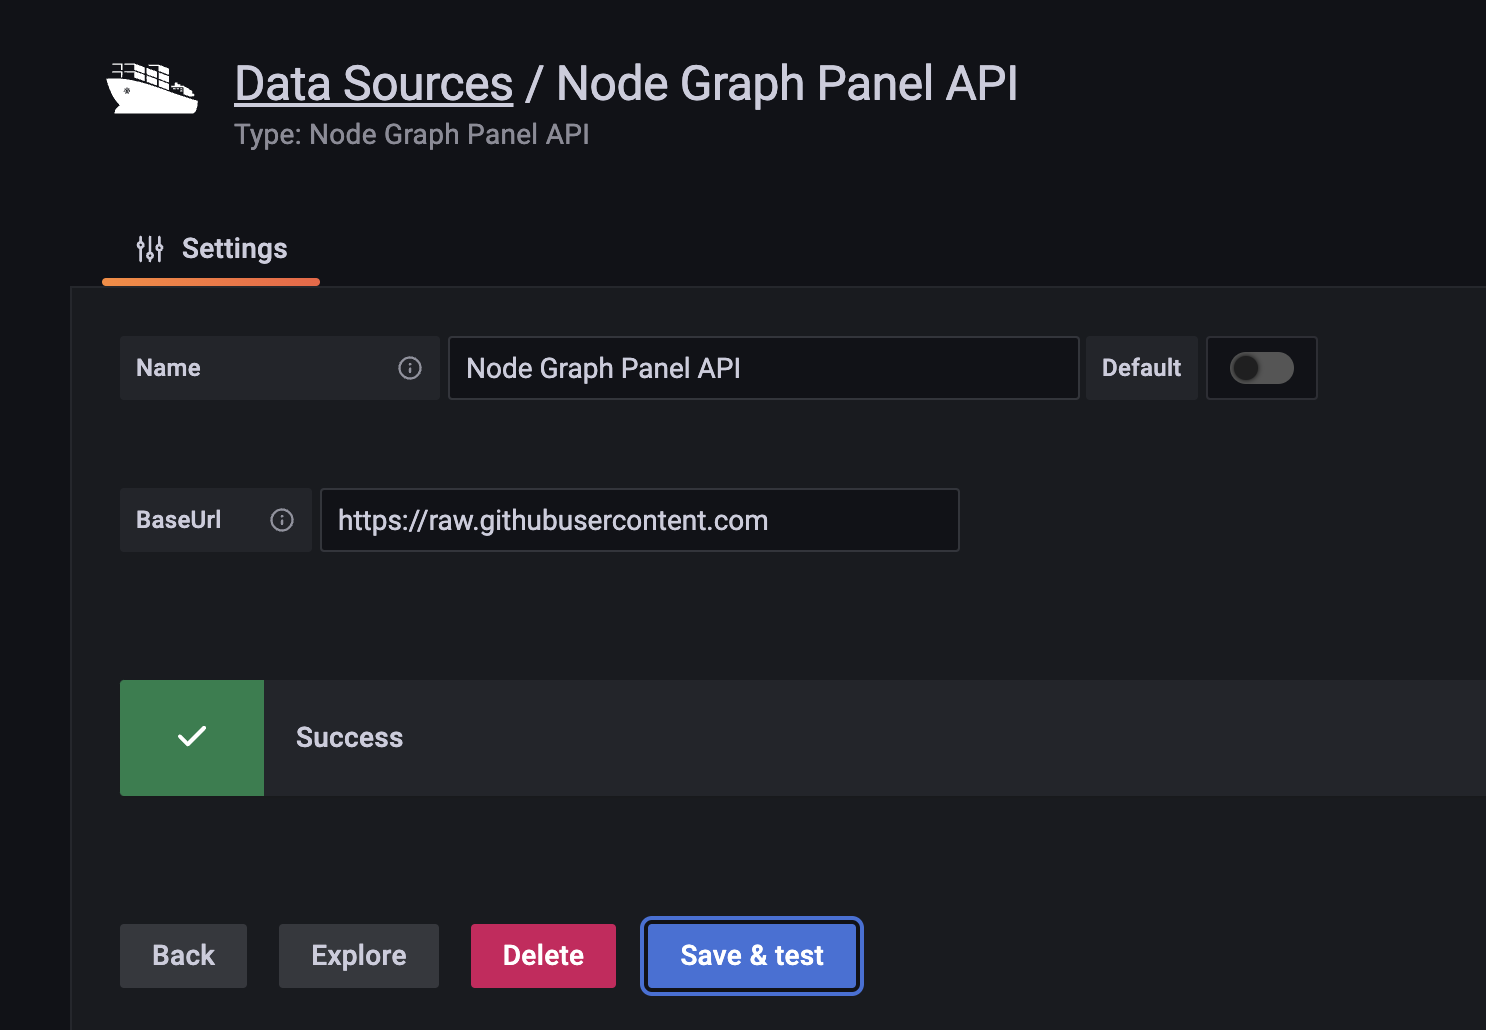
Add and configure datasource plugin in your Grafana instance
As `baseUrl` you can enter URL to your metrics service API

### Explore
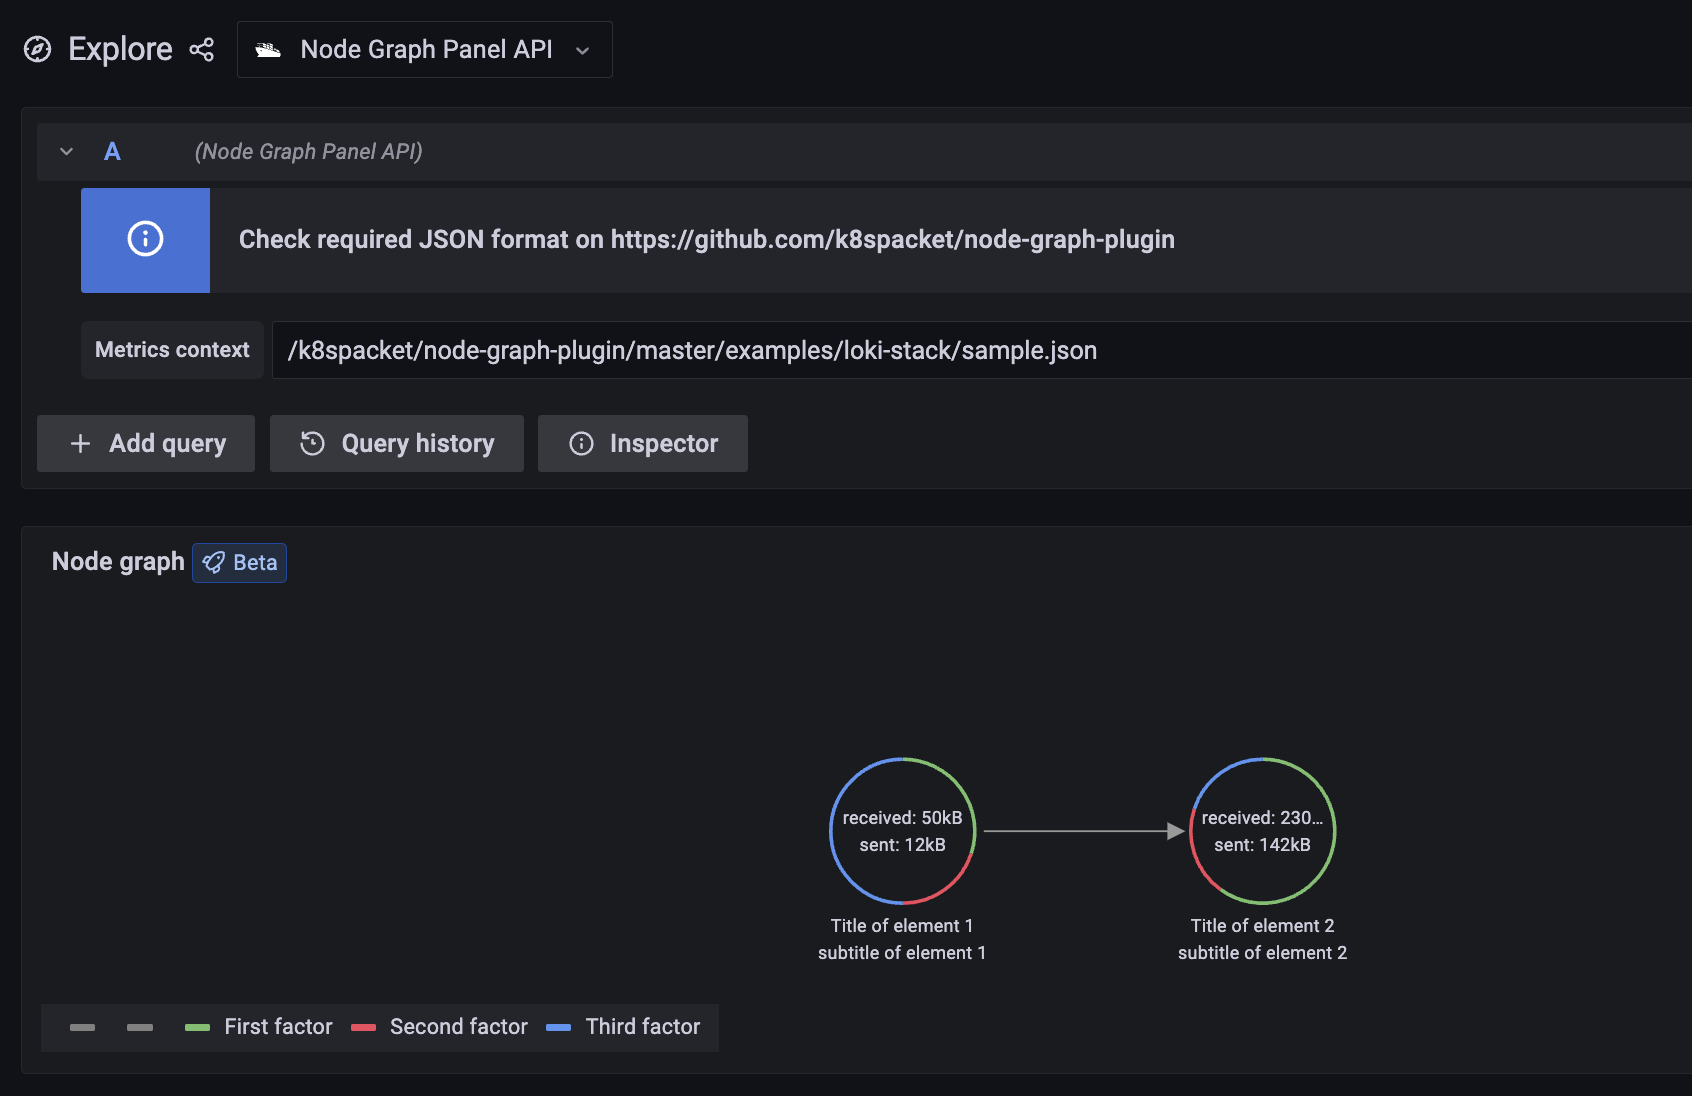
Go to Explore, select `Node Graph Panel API` as datasource, and provide context of metrics endpoint
