https://github.com/kalkih/mini-graph-card
Minimalistic graph card for Home Assistant Lovelace UI
https://github.com/kalkih/mini-graph-card
automation custom graph hacktoberfest hassio home-assistant lovelace lovelace-ui sensor
Last synced: 9 months ago
JSON representation
Minimalistic graph card for Home Assistant Lovelace UI
- Host: GitHub
- URL: https://github.com/kalkih/mini-graph-card
- Owner: kalkih
- License: mit
- Created: 2018-10-02T15:42:27.000Z (over 7 years ago)
- Default Branch: master
- Last Pushed: 2025-05-12T20:47:55.000Z (9 months ago)
- Last Synced: 2025-05-12T21:43:23.008Z (9 months ago)
- Topics: automation, custom, graph, hacktoberfest, hassio, home-assistant, lovelace, lovelace-ui, sensor
- Language: JavaScript
- Homepage:
- Size: 437 KB
- Stars: 3,396
- Watchers: 41
- Forks: 250
- Open Issues: 143
-
Metadata Files:
- Readme: README.md
- Changelog: CHANGELOG.md
- Contributing: CONTRIBUTING.md
- License: LICENSE
Awesome Lists containing this project
- Self-Hosting-Guide - Mini Graph Card - A minimalistic sensor graph card. (Install from Source / Smart Home Automation)
- awesome-home-assistant - Mini Graph Card - A minimalistic sensor graph card. (Dashboards / Custom Cards)
README
# Lovelace Mini Graph Card
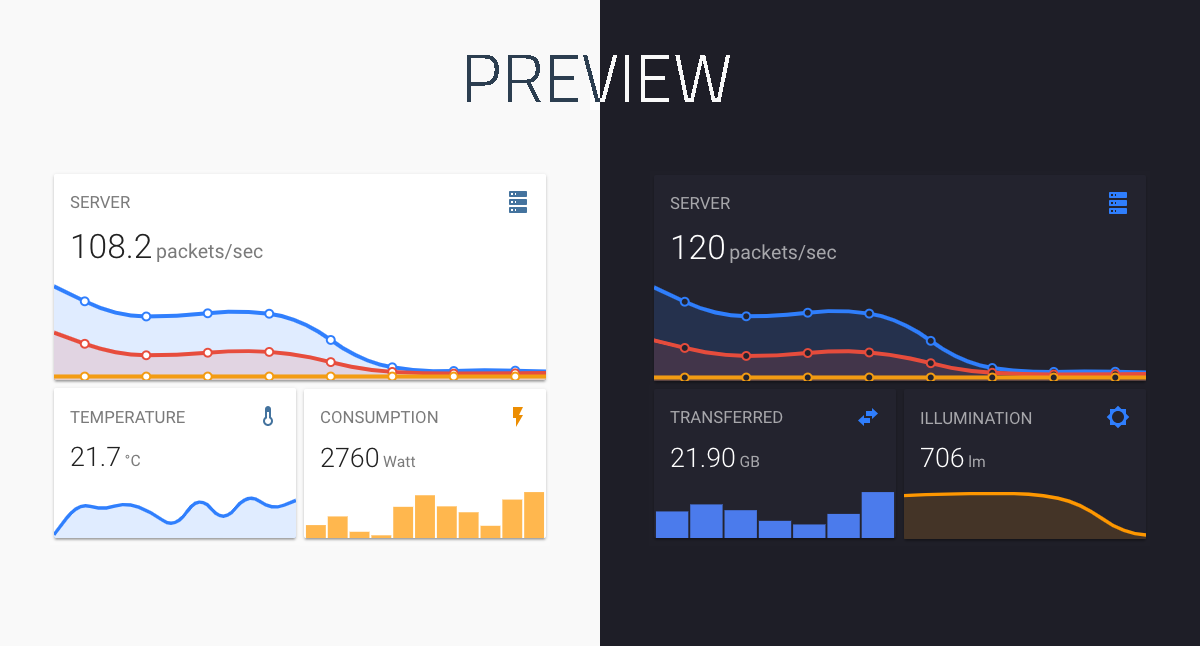
A minimalistic and customizable graph card for [Home Assistant](https://github.com/home-assistant/home-assistant) Lovelace UI.
The card works with entities from within the **sensor** & **binary_sensor** domain and displays the sensors current state as well as a line graph representation of the history.
## Install
### HACS (recommended)
This card is available in [HACS](https://hacs.xyz/) (Home Assistant Community Store).
*HACS is a third party community store and is not included in Home Assistant out of the box.*
### Manual install
1. Download and copy `mini-graph-card-bundle.js` from the [latest release](https://github.com/kalkih/mini-graph-card/releases/latest) into your `config/www` directory.
2. Add the resource reference as decribed below.
### CLI install
1. Move into your `config/www` directory.
2. Grab `mini-graph-card-bundle.js`:
```
$ wget https://github.com/kalkih/mini-graph-card/releases/download/v0.12.1/mini-graph-card-bundle.js
```
3. Add the resource reference as decribed below.
### Add resource reference
If you configure Lovelace via YAML, add a reference to `mini-graph-card-bundle.js` inside your `configuration.yaml`:
```yaml
resources:
- url: /local/mini-graph-card-bundle.js?v=0.12.1
type: module
```
Else, if you prefer the graphical editor, use the menu to add the resource:
1. Make sure, advanced mode is enabled in your user profile (click on your user name to get there)
2. Navigate to Configuration -> Lovelace Dashboards -> Resources Tab. Hit orange (+) icon
3. Enter URL `/local/mini-graph-card-bundle.js` and select type "JavaScript Module".
(Use `/hacsfiles/mini-graph-card/mini-graph-card-bundle.js` and select "JavaScript Module" for HACS install)
4. Restart Home Assistant.
## Updating
**If you have a version older than v0.0.8 installed, please delete the current files and follow the installation instructions again.**
1. Find your `mini-graph-card-bundle.js` file in `config/www` or wherever you ended up storing it.
2. Replace the local file with the latest one attached in the [latest release](https://github.com/kalkih/mini-graph-card/releases/latest).
3. Add the new version number to the end of the cards reference url in your `ui-lovelace.yaml` like below:
```yaml
resources:
- url: /local/mini-graph-card-bundle.js?v=0.12.1
type: module
```
*You may need to empty the browsers cache if you have problems loading the updated card.*
## Using the card
We recommend looking at the [Example usage section](#example-usage) to understand the basics to configure this card.
(also) pay attention to the **required** options mentioned below.
### Options
#### Card options
| Name | Type | Default | Since | Description |
|------|:----:|:-------:|:-----:|-------------|
| type ***(required)*** | string | | v0.0.1 | `custom:mini-graph-card`.
| entities ***(required)*** | list | | v0.2.0 | One or more sensor entities in a list, see [entities object](#entities-object) for additional entity options.
| icon | string | | v0.0.1 | Set a custom icon from any of the available mdi icons.
| icon_image | string | | v0.12.0 | Override icon with an image url
| name | string | | v0.0.1 | Set a custom name which is displayed beside the icon.
| unit | string | | v0.0.1 | Set a custom unit of measurement.
| tap_action | [action object](#action-object-options) | | v0.7.0 | Action on click/tap.
| group | boolean | `false` | v0.2.0 | Disable paddings and box-shadow, useful when nesting the card.
| hours_to_show | integer | `24` | v0.0.2 | Specify how many hours of history the graph should present.
| points_per_hour | number | `0.5` | v0.2.0 | Specify amount of data points the graph should display for each hour, *(basically the detail/accuracy/smoothing of the graph)*.
| aggregate_func | string | `avg` | v0.8.0 | Specify [aggregate function](#aggregate-functions) used to calculate point/bar in the graph.
| group_by | string | `interval` | v0.8.0 | Specify type of grouping of data, dynamic `interval`, `date` or `hour`.
| update_interval | number | | v0.4.0 | Specify a custom update interval of the history data (in seconds), instead of on every state change.
| cache | boolean | `true` | v0.9.0 | Enable/disable local caching of history data.
| show | list | | v0.2.0 | List of UI elements to display/hide, for available items see [available show options](#available-show-options).
| animate | boolean | `false` | v0.2.0 | Add a reveal animation to the graph.
| height | number | `150` | v0.0.1 | Set a custom height of the line graph.
| bar_spacing | number | `4` | v0.9.0 | Set the spacing between bars in bar graph.
| line_width | number | `5` | v0.0.1 | Set the thickness of the line.
| line_color | string/list | `var(--accent-color)` | v0.0.1 | Set a custom color for the graph line, provide a list of colors for multiple graph entries.
| color_thresholds | list | | v0.2.3 | Set thresholds for dynamic graph colors, see [Line color object](#line-color-object).
| color_thresholds_transition | string | `smooth` | v0.4.3 | Color threshold transition, `smooth` or `hard`.
| decimals | integer | | v0.0.9 | Specify the exact number of decimals to show for states.
| hour24 | boolean | `false` | v0.2.1 | Set to `true` to display times in 24-hour format.
| font_size | number | `100` | v0.0.3 | Adjust the font size of the state, as percentage of the original size.
| font_size_header | number | `14` | v0.3.1 | Adjust the font size of the header, size in pixels.
| align_header | string | `default` | v0.2.0 | Set the alignment of the header, `left`, `right`, `center` or `default`.
| align_icon | string | `right` | v0.2.0 | Set the alignment of the icon, `left`, `right` or `state`.
| align_state | string | `left` | v0.2.0 | Set the alignment of the current state, `left`, `right` or `center`.
| lower_bound | number *or* string | | v0.2.3 | Set a fixed lower bound for the graph Y-axis. String value starting with ~ (e.g. `~50`) specifies soft bound.
| upper_bound | number *or* string | | v0.2.3 | Set a fixed upper bound for the graph Y-axis. String value starting with ~ (e.g. `~50`) specifies soft bound.
| min_bound_range | number | | v0.x.x | Applied after everything, makes sure there's a minimum range that the Y-axis will have. Useful for not making small changes look large because of scale.
| lower_bound_secondary | number *or* string | | v0.5.0 | Set a fixed lower bound for the graph secondary Y-axis. String value starting with ~ (e.g. `~50`) specifies soft bound.
| upper_bound_secondary | number *or* string | | v0.5.0 | Set a fixed upper bound for the graph secondary Y-axis. String value starting with ~ (e.g. `~50`) specifies soft bound.
| min_bound_range_secondary | number | | v0.x.x | Applied after everything, makes sure there's a minimum range that the secondary Y-axis will have. Useful for not making small changes look large because of scale.
| smoothing | boolean | `true` | v0.8.0 | Whether to make graph line smooth.
| state_map | [state map object](#state-map-object) | | v0.8.0 | List of entity states to convert (order matters as position becomes a value on the graph).
| value_factor | number | 0 | v0.9.4 | Scale value by order of magnitude (e.g. convert Watts to kilo Watts), use negative value to scale down.
| logarithmic | boolean | `false` | v0.10.0 | Use a Logarithmic scale for the graph
#### Entities object
Entities may be listed directly (as per `sensor.temperature` in the example below), or defined using
properties of the Entity object detailed in the following table (as per `sensor.pressure` in the example below).
| Name | Type | Default | Description |
|------|:----:|:-------:|-------------|
| entity ***(required)*** | string | | Entity id of the sensor.
| attribute | string | | Retrieves an attribute or [sub-attribute (attr1.attr2...)](#accessing-attributes-in-complex-structures) instead of the state
| name | string | | Set a custom display name, defaults to entity's friendly_name.
| color | string | | Set a custom color, overrides all other color options including thresholds.
| unit | string | | Set a custom unit of measurement, overrides `unit` set in base config.
| aggregate_func | string | | Override for aggregate function used to calculate point on the graph, `avg`, `median`, `min`, `max`, `first`, `last`, `sum`.
| show_state | boolean | | Display the current state.
| show_indicator | boolean | | Display a color indicator next to the state, (only when more than two states are visible).
| show_graph | boolean | | Set to false to completely hide the entity in the graph.
| show_line | boolean | | Set to false to hide the line.
| show_fill | boolean | | Set to false to hide the fill.
| show_points | boolean | | Set to false to hide the points.
| show_legend | boolean | | Set to false to turn hide from the legend.
| state_adaptive_color | boolean | | Make the color of the state adapt to the entity color.
| y_axis | string | | If 'secondary', displays using the secondary y-axis on the right.
| fixed_value | boolean | | Set to true to graph the entity's current state as a fixed value instead of graphing its state history.
| smoothing | boolean | | Override for a flag indicating whether to make graph line smooth.
```yaml
entities:
- sensor.temperature
- entity: sensor.pressure
name: Pressure
show_state: true
- sensor.humidity
```
#### Available show options
All properties are optional.
| Name | Default | Options | Description |
|------|:-------:|:-------:|-------------|
| name | `true` | `true` / `false` | Display name.
| icon | `true` | `true` / `false` | Display icon.
| state | `true` | `true` / `false` / `last` | Display current state. `last` will show the last graph point's value.
| graph | `line` | `line` / `bar` / `false` | Display option for the graph. If set to `bar` a maximum of `96` bars will be displayed.
| fill | `true` | `true` / `false` / `fade` | Display the line graph fill.
| points | `hover` | `true` / `false` / `hover` | Display graph data points.
| legend | `true` | `true` / `false` | Display the graph legend (only shown when graph contains multiple entities).
| average | `false` | `true` / `false` | Display average information.
| extrema | `false` | `true` / `false` | Display max/min information.
| labels | `hover` | `true` / `false` / `hover` | Display Y-axis labels.
| labels_secondary | `hover` | `true` / `false` / `hover` | Display secondary Y-axis labels.
| name_adaptive_color | `false` | `true` / `false` | Make the name color adapt with the primary entity color.
| icon_adaptive_color | `false` | `true` / `false` | Make the icon color adapt with the primary entity color.
#### Line color object
See [dynamic line color](#dynamic-line-color) for example usage.
| Name | Type | Default | Description |
|------|:----:|:-------:|-------------|
| value ***(required [except in interpolation (see below)](#line-color-interpolation-of-stop-values))*** | number | | The threshold for the color stop.
| color ***(required)*** | string | | Color in 6 digit hex format (e.g. `#008080`).
##### Line color interpolation of stop values
As long as the first and last threshold stops have `value` properties, intermediate stops can exclude `value`; they will be interpolated linearly. For example, given stops like:
```yaml
color_thresholds:
- value: 0
color: "#ff0000"
- color: "#ffff00"
- color: "#00ff00"
- value: 4
color: "#0000ff"
```
The values will be interpolated as:
```yaml
color_thresholds:
- value: 0
color: "#ff0000"
- value: 1.333333
color: "#ffff00"
- value: 2.666667
color: "#00ff00"
- value: 4
color: "#0000ff"
```
The example above will result in the following colors of the graph: if value is
* between `0` (including this value) and `1.33333`, the color is `#ff0000`,
* between `1.33333` (including this value) and `2.666667`, the color is `#ffff00`,
* between `2.666667` (including this value) and `4`, the color is `#00ff00`,
* equal to or more than `4`, the color is `#0000ff`.
As a shorthand, you can just use a color string for the stops that you want interpolated:
```yaml
- value: 0
color: "#ff0000"
- "#ffff00"
- "#00ff00"
- value: 4
color: "#0000ff"
```
#### Action object options
| Name | Type | Default | Options | Description |
|------|:----:|:-------:|:-----------:|-------------|
| action | string | `more-info` | `more-info` / `navigate` / `call-service` / `url` / `none` | Action to perform.
| entity | string | | Any entity id | Override default entity of `more-info`, when `action` is defined as `more-info`.
| service | string | | Any service | Service to call (e.g. `media_player.toggle`) when `action` is defined as `call-service`.
| service_data | object | | Any service data | Service data to include with the service call (e.g. `entity_id: media_player.office`).
| navigation_path | string | | Any path | Path to navigate to (e.g. `/lovelace/0/`) when `action` is defined as `navigate`.
| url | string | | Any URL | URL to open when `action` is defined as `url`.
#### State map object
| Name | Type | Default | Description |
|------|:----:|:-------:|-------------|
| value ***(required)*** | string | | Value to convert.
| label | string | same as value | String to show as label (if the value is not precise).
### Aggregate functions
Recorded values are grouped in time buckets which are determined by `group_by`, `points_per_hour` configuration.
These buckets are converted later to single point/bar on the graph. Aggregate function defines the methods of that conversion.
| Name | Since | Description |
|------|:-------:|-------------|
| `avg` | v0.8.0 | Average
| `median` | v0.11.0 | Median
| `min` | v0.8.0 | Minimum - lowest value
| `max` | v0.8.0 | Maximum - largest value
| `first` | v0.9.0 |
| `last` | v0.9.0 |
| `sum` | v0.9.2 |
| `delta` | v0.9.4 | Calculates difference between max and min value
| `diff` | v0.11.0 | Calculates difference between first and last value
### Theme variables
The following theme variables can be set in your HA theme to customize the appearance of the card.
| Name | Default | Description |
|------|:-------:|-------------|
| mcg-title-letter-spacing | | Letter spacing of the card title (`name` option).
| mcg-title-font-weight | 500 | Font weight of the card title.
### Example usage
#### Single entity card
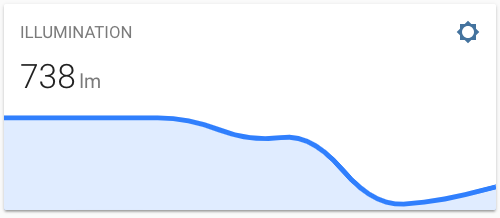
```yaml
type: custom:mini-graph-card
entities:
- sensor.illumination
```
#### Alternative style
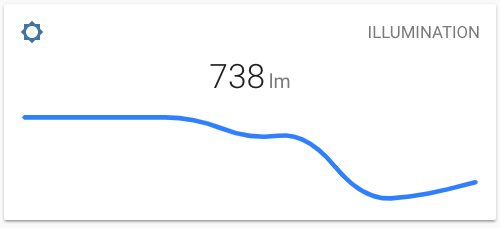
```yaml
type: custom:mini-graph-card
entities:
- sensor.illumination
align_icon: left
align_state: center
show:
fill: false
```
#### Multiple entities card
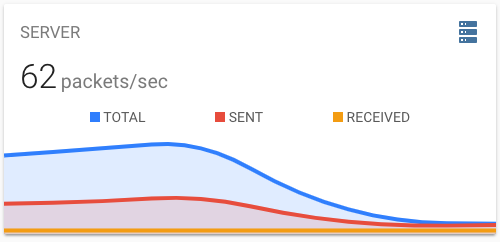
```yaml
type: custom:mini-graph-card
name: SERVER
icon: mdi:server
entities:
- entity: sensor.server_total
name: TOTAL
- sensor.server_sent
- sensor.server_received
```
#### Bar chart card
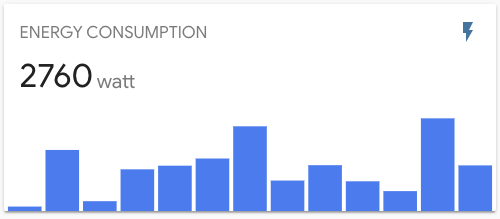
```yaml
type: custom:mini-graph-card
entities:
- entity: sensor.energy_consumption
name: ENERGY CONSUMPTION
show:
graph: bar
```
#### Show data from the past week
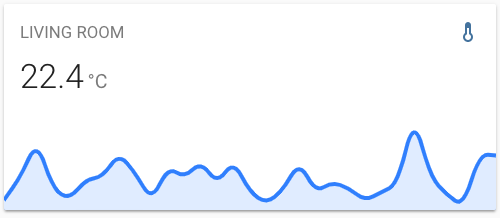
Use the `hours_to_show` option to specify how many hours of history the graph should represent.
Use the `points_per_hour` option to specify the accuracy/detail of the graph.
```yaml
type: custom:mini-graph-card
entities:
- sensor.living_room_temp
name: LIVING ROOM
hours_to_show: 168
points_per_hour: 0.25
```
#### Graph only card
Use the `show` option to show/hide UI elements.
```yaml
type: custom:mini-graph-card
entities:
- sensor.humidity
show:
icon: false
name: false
state: false
```
#### Horizontally stacked cards
You can stack cards horizontally by using one or more `horizontal-stack(s)`.

```yaml
type: horizontal-stack
cards:
- type: custom:mini-graph-card
entities:
- sensor.humidity
line_color: blue
line_width: 8
font_size: 75
- type: custom:mini-graph-card
entities:
- sensor.illumination
line_color: '#e74c3c'
line_width: 8
font_size: 75
- type: custom:mini-graph-card
entities:
- sensor.temperature
line_color: var(--accent-color)
line_width: 8
font_size: 75
```
#### Dynamic line color
Have the graph change line color dynamically.
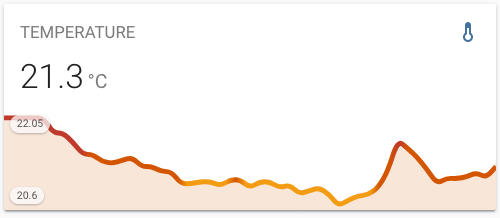
```yaml
type: custom:mini-graph-card
entities:
- sensor.sensor_temperature
show:
labels: true
color_thresholds:
- value: 20
color: "#f39c12"
- value: 21
color: "#d35400"
- value: 21.5
color: "#c0392b"
```
#### Alternate y-axis
Have one or more series plot on a separate y-axis, which appears on the right side of the graph. This example also
shows turning off the line, points and legend.
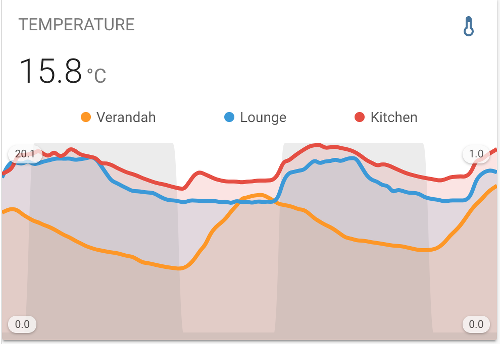
```yaml
type: custom:mini-graph-card
entities:
- entity: sensor.verandah
name: Verandah
- entity: sensor.lounge
name: Lounge
- entity: sensor.kitchen
name: Kitchen
- color: gray
entity: input_number.nighttime
name: Night
show_line: false
show_points: false
show_legend: false
y_axis: secondary
show:
labels: true
labels_secondary: true
```
#### Grouping by date
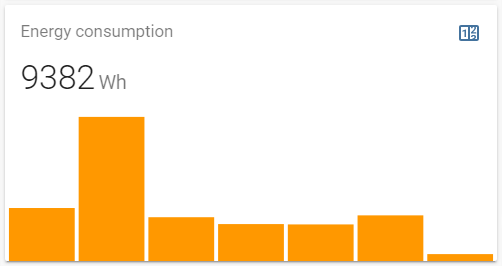
You can group values by date, this way you can visualize for example daily energy consumption.
```yaml
type: custom:mini-graph-card
entities:
- entity: sensor.energy_daily
name: Energy consumption
hours_to_show: 168
aggregate_func: max
group_by: date
show:
graph: bar
```
#### Data aggregation functions
You can decide how values are aggregated for points on graph. Example how to display min, max, avg temperature per day
from last week.
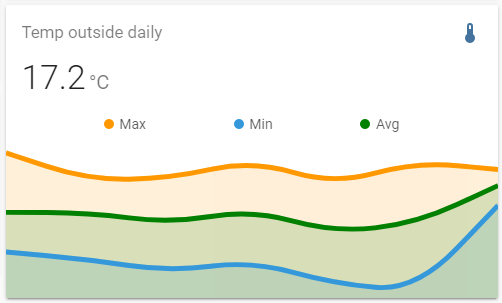
```yaml
type: custom:mini-graph-card
entities:
- entity: sensor.outside_temp
aggregate_func: max
name: Max
color: "#e74c3c"
- entity: sensor.outside_temp
aggregate_func: min
name: Min
- entity: sensor.outside_temp
aggregate_func: avg
name: Avg
color: green
name: Temp outside daily (last week)
hours_to_show: 168
group_by: date
```
#### Non-numeric sensor states
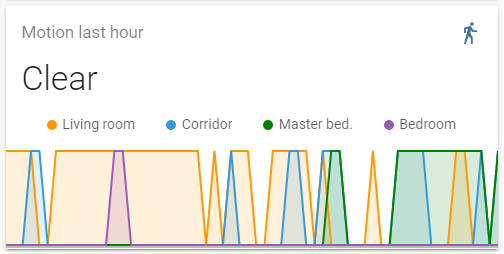
You can render non-numeric states by providing state_map config. For example this way you can show data coming from binary sensors.
```yaml
type: custom:mini-graph-card
entities:
- entity: binary_sensor.living_room_motion
name: Living room
- entity: binary_sensor.corridor_motion
name: Corridor
- entity: binary_sensor.master_bed_motion
name: Master bed.
color: green
- entity: binary_sensor.bedroom_motion
name: Bedroom
name: Motion last hour
hours_to_show: 1
points_per_hour: 60
update_interval: 30
aggregate_func: max
line_width: 2
smoothing: false
state_map:
- value: "off"
label: Clear
- value: "on"
label: Detected
```
#### Showing additional info on the card
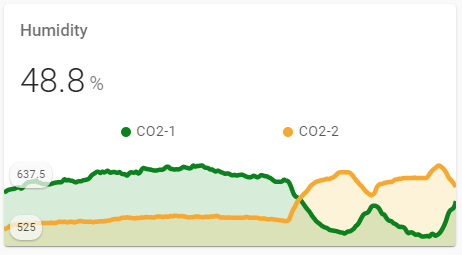
It is possible to show a state without displaying a graph for a sensor.
Imagine there are two CO-2 sensors & one humidity sensor; graphs are displayed for the CO-2 only, and the humidity is shown as a state only.
```
type: custom:mini-graph-card
entities:
- entity: sensor.xiaomi_cg_1_humidity
show_state: true
show_graph: false
- entity: sensor.xiaomi_cg_1_co2
color: green
show_state: false
name: CO2-1
- entity: sensor.xiaomi_cg_2_co2
color: orange
show_state: false
name: CO2-2
name: Humidity
hours_to_show: 4
points_per_hour: 60
show:
name: true
legend: true
icon: false
labels: true
```
This method may be also used to add a calculated value with it's own `aggregate_func` option.
#### Accessing attributes in complex structures
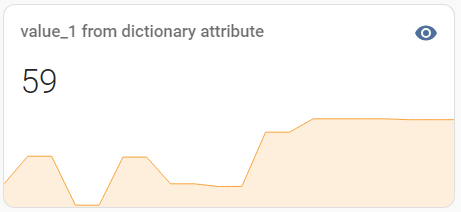
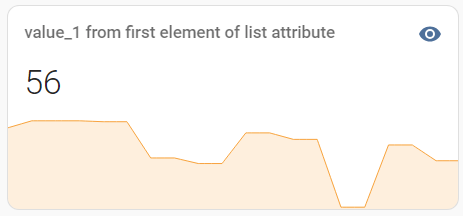
When using the `attribute` option in the [entities object](#entities-object), you can access data in structured attributes, such as dictionaries and lists.
##### Accessing dictionary attributes
Suppose you have data stored inside a *dictionary* attribute named `dict_attribute`
```yaml
dict_attribute:
value_1: 53
value_2: 64
value_3: 72
```
Such data should be addressed as `dict_attribute.sub_attribute`:
```
type: custom:mini-graph-card
entities:
- entity: sensor.testing_object_data
attribute: dict_attribute.value_1
name: value_1 from dictionary attribute
```
##### Accessing list attributes
Suppose you have data stored inside a *list* attribute named `list_attribute`:
```yaml
list_attribute:
- value_1: 67
value_2: 65
value_3: 93
- value_1: 134
value_2: 130
value_3: 186
- value_1: 201
value_2: 195
value_3: 279
```
Such data should be addressed as `list_attribute.index.sub_attribute`:
```
type: custom:mini-graph-card
entities:
- entity: sensor.testing_object_data_list
attribute: list_attribute.0.value_1
name: value_1 from first element of list attribute
```
## Development
1. Clone this repository into your `config/www` folder using git:
```
$ git clone https://github.com/kalkih/mini-graph-card.git
```
2. Add a reference to the card in your `ui-lovelace.yaml`:
```yaml
resources:
- url: /local/mini-graph-card/dist/mini-graph-card-bundle.js
type: module
```
### Instructions
*Requires `nodejs` & `npm`.*
1. Move into the `mini-graph-card` repo, checkout the *dev* branch & install dependencies:
```console
$ cd mini-graph-card && git checkout dev && npm install
```
2. Make changes to the source code.
3. Build the source by running:
```console
$ npm run build
```
4. Refresh the browser to see changes.
*Make sure cache is cleared or disabled.*
5. *(Optional)* Watch the source and automatically rebuild on save:
```console
$ npm run watch
```
*The new `mini-graph-card-bundle.js` will be build and ready inside `/dist`.*
Note that the `dev` branch is the most up-to-date and matches our beta releases.
Please refer to the [Contribution Guidelines](./CONTRIBUTING.md) if you're interested in contributing to the project. (And thanks for considering!)
## Getting errors?
Make sure you have `javascript_version: latest` in your `configuration.yaml` under `frontend:`.
Make sure you have the latest versions of `mini-graph-card.js` & `mini-graph-lib.js`.
If you have issues after updating the card, try clearing your browser cache.
If you have issues displaying the card in older browsers, try changing `type: module` to `type: js` at the card reference in `ui-lovelace.yaml`.
## License
This project is under the MIT license.