https://github.com/kamon-io/docker-grafana-graphite
Docker image with StatsD, Graphite, Grafana 2 and a Kamon Dashboard
https://github.com/kamon-io/docker-grafana-graphite
Last synced: 8 months ago
JSON representation
Docker image with StatsD, Graphite, Grafana 2 and a Kamon Dashboard
- Host: GitHub
- URL: https://github.com/kamon-io/docker-grafana-graphite
- Owner: kamon-io
- License: apache-2.0
- Created: 2014-04-22T20:38:49.000Z (over 11 years ago)
- Default Branch: master
- Last Pushed: 2022-02-27T18:56:42.000Z (almost 4 years ago)
- Last Synced: 2024-02-15T01:32:56.260Z (almost 2 years ago)
- Language: Dockerfile
- Homepage:
- Size: 98.6 KB
- Stars: 1,144
- Watchers: 60
- Forks: 500
- Open Issues: 47
-
Metadata Files:
- Readme: README.md
- License: LICENSE
Awesome Lists containing this project
README
StatsD + Graphite + Grafana 4 + Kamon Dashboards
---------------------------------------------
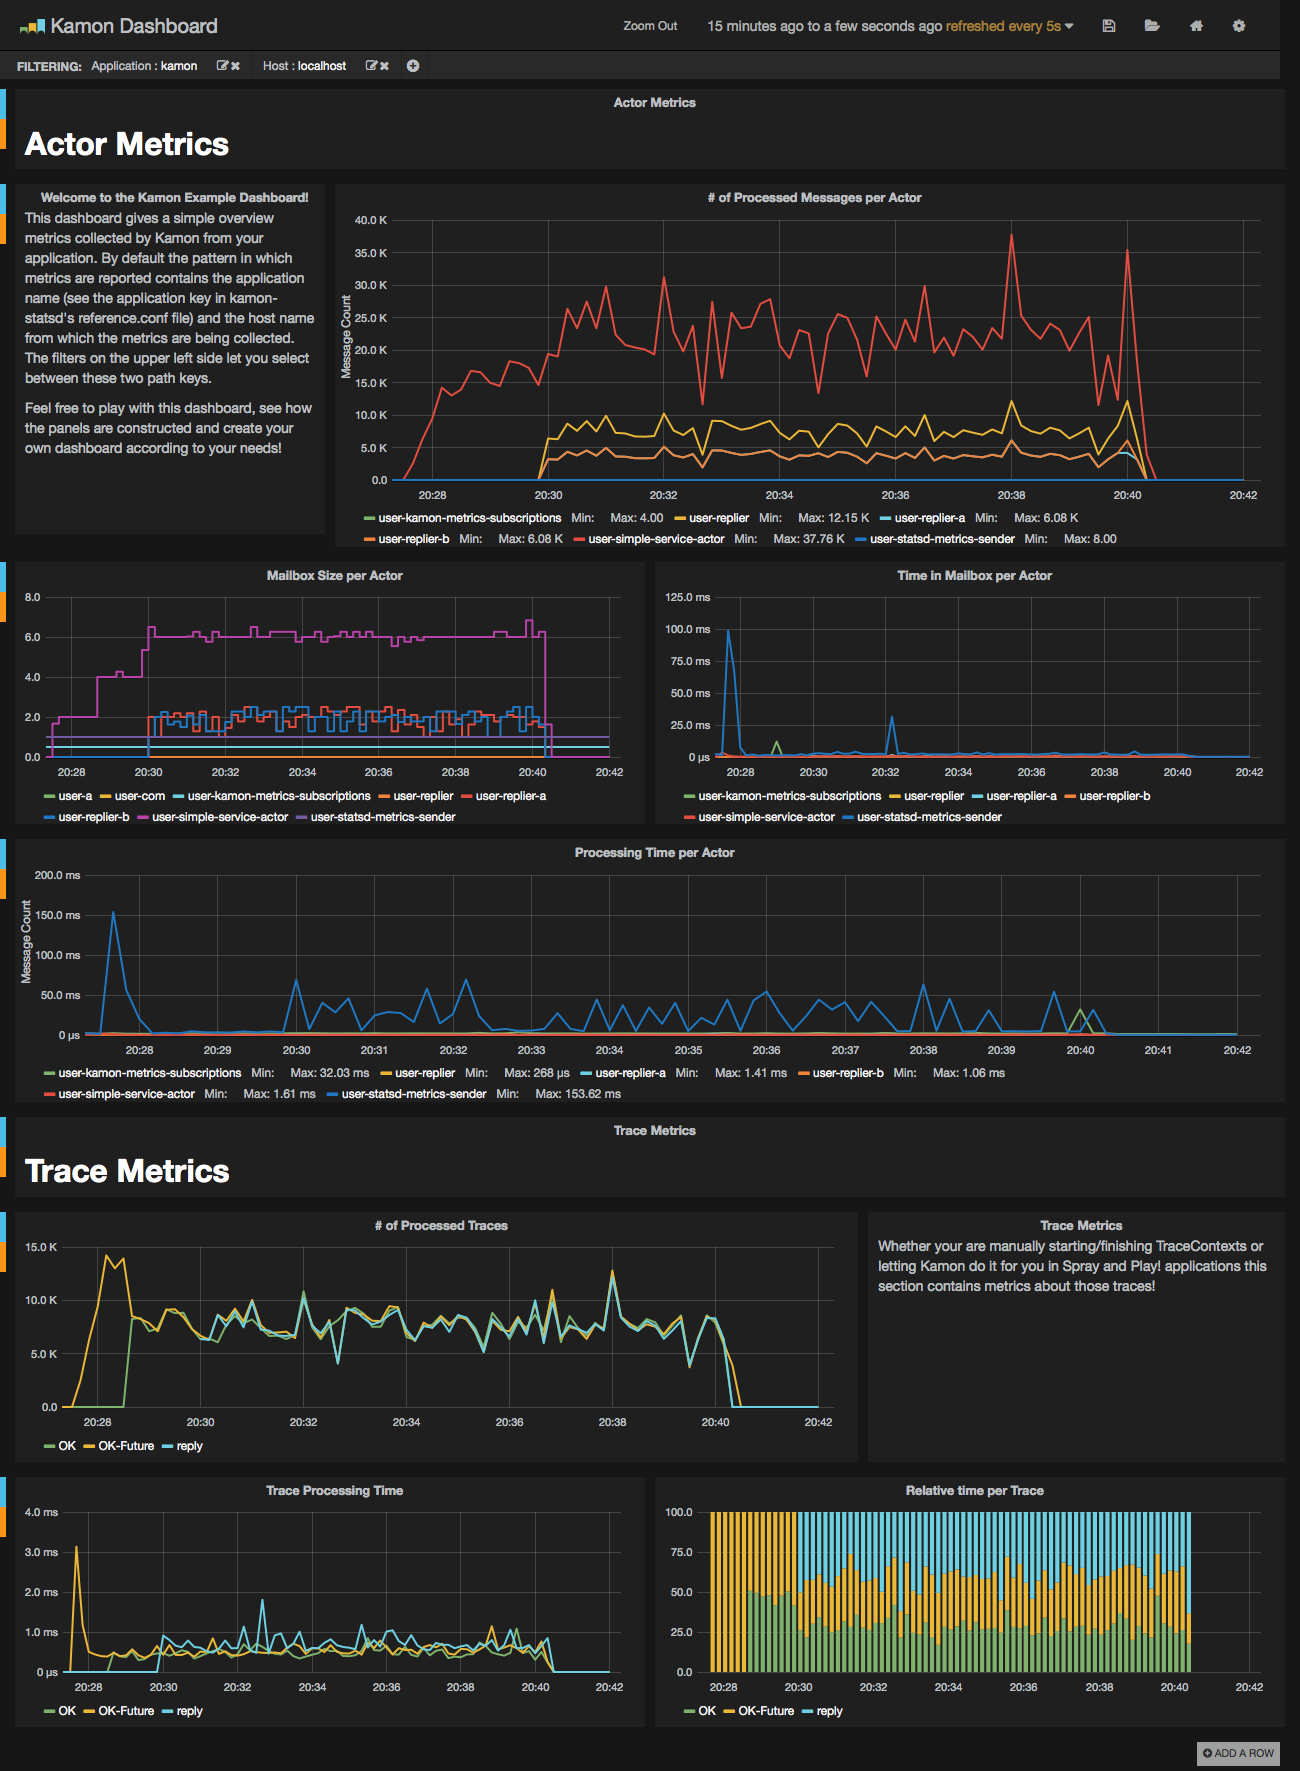
This image contains a sensible default configuration of StatsD, Graphite and Grafana, and comes bundled with a example
dashboard that gives you the basic metrics currently collected by Kamon for both Actors and Traces. There are two ways
for using this image:
### Using the Docker Index ###
This image is published under [Kamon's repository on the Docker Hub](https://hub.docker.com/u/kamon/) and all you
need as a prerequisite is having `docker`, `docker-compose`, and `make` installed on your machine. The container exposes the following ports:
- `80`: the Grafana web interface.
- `81`: the Graphite web port
- `2003`: the Graphite data port
- `8125`: the StatsD port.
- `8126`: the StatsD administrative port.
To start a container with this image you just need to run the following command:
```bash
$ make up
```
To stop the container
```bash
$ make down
```
To run container's shell
```bash
$ make shell
```
To view the container log
```bash
$ make tail
```
If you already have services running on your host that are using any
of these ports, you may wish to map the container ports to whatever
you want by changing left side number in the `--publish` parameters,
or the 'ports' parameters in 'docker-compose.yml'. You can omit ports
you do not plan to use. Find more details about mapping ports in the
Docker documentation on [Binding container ports to the
host](https://docs.docker.com/engine/userguide/networking/default_network/binding/)
and [Legacy container
links](https://docs.docker.com/engine/userguide/networking/default_network/dockerlinks/).
### Building the image yourself ###
The Dockerfile and supporting configuration files are available in our [Github repository](https://github.com/kamon-io/docker-grafana-graphite).
This comes specially handy if you want to change any of the StatsD, Graphite or Grafana settings, or simply if you want
to know how the image was built.
### Using the Dashboards ###
Once your container is running all you need to do is:
- open your browser pointing to http://localhost:80 (or another port if you changed it)
- Docker with VirtualBox on macOS: use `docker-machine ip` instead of `localhost`
- login with the default username (admin) and password (admin)
- open existing dashboard (or create a new one) and select 'Local Graphite' datasource
- play with the dashboard at your wish...
### Persisted Data ###
When running `make up`, directories are created on your host and mounted into the Docker container, allowing graphite and grafana to persist data and settings between runs of the container.
### Now go explore! ###
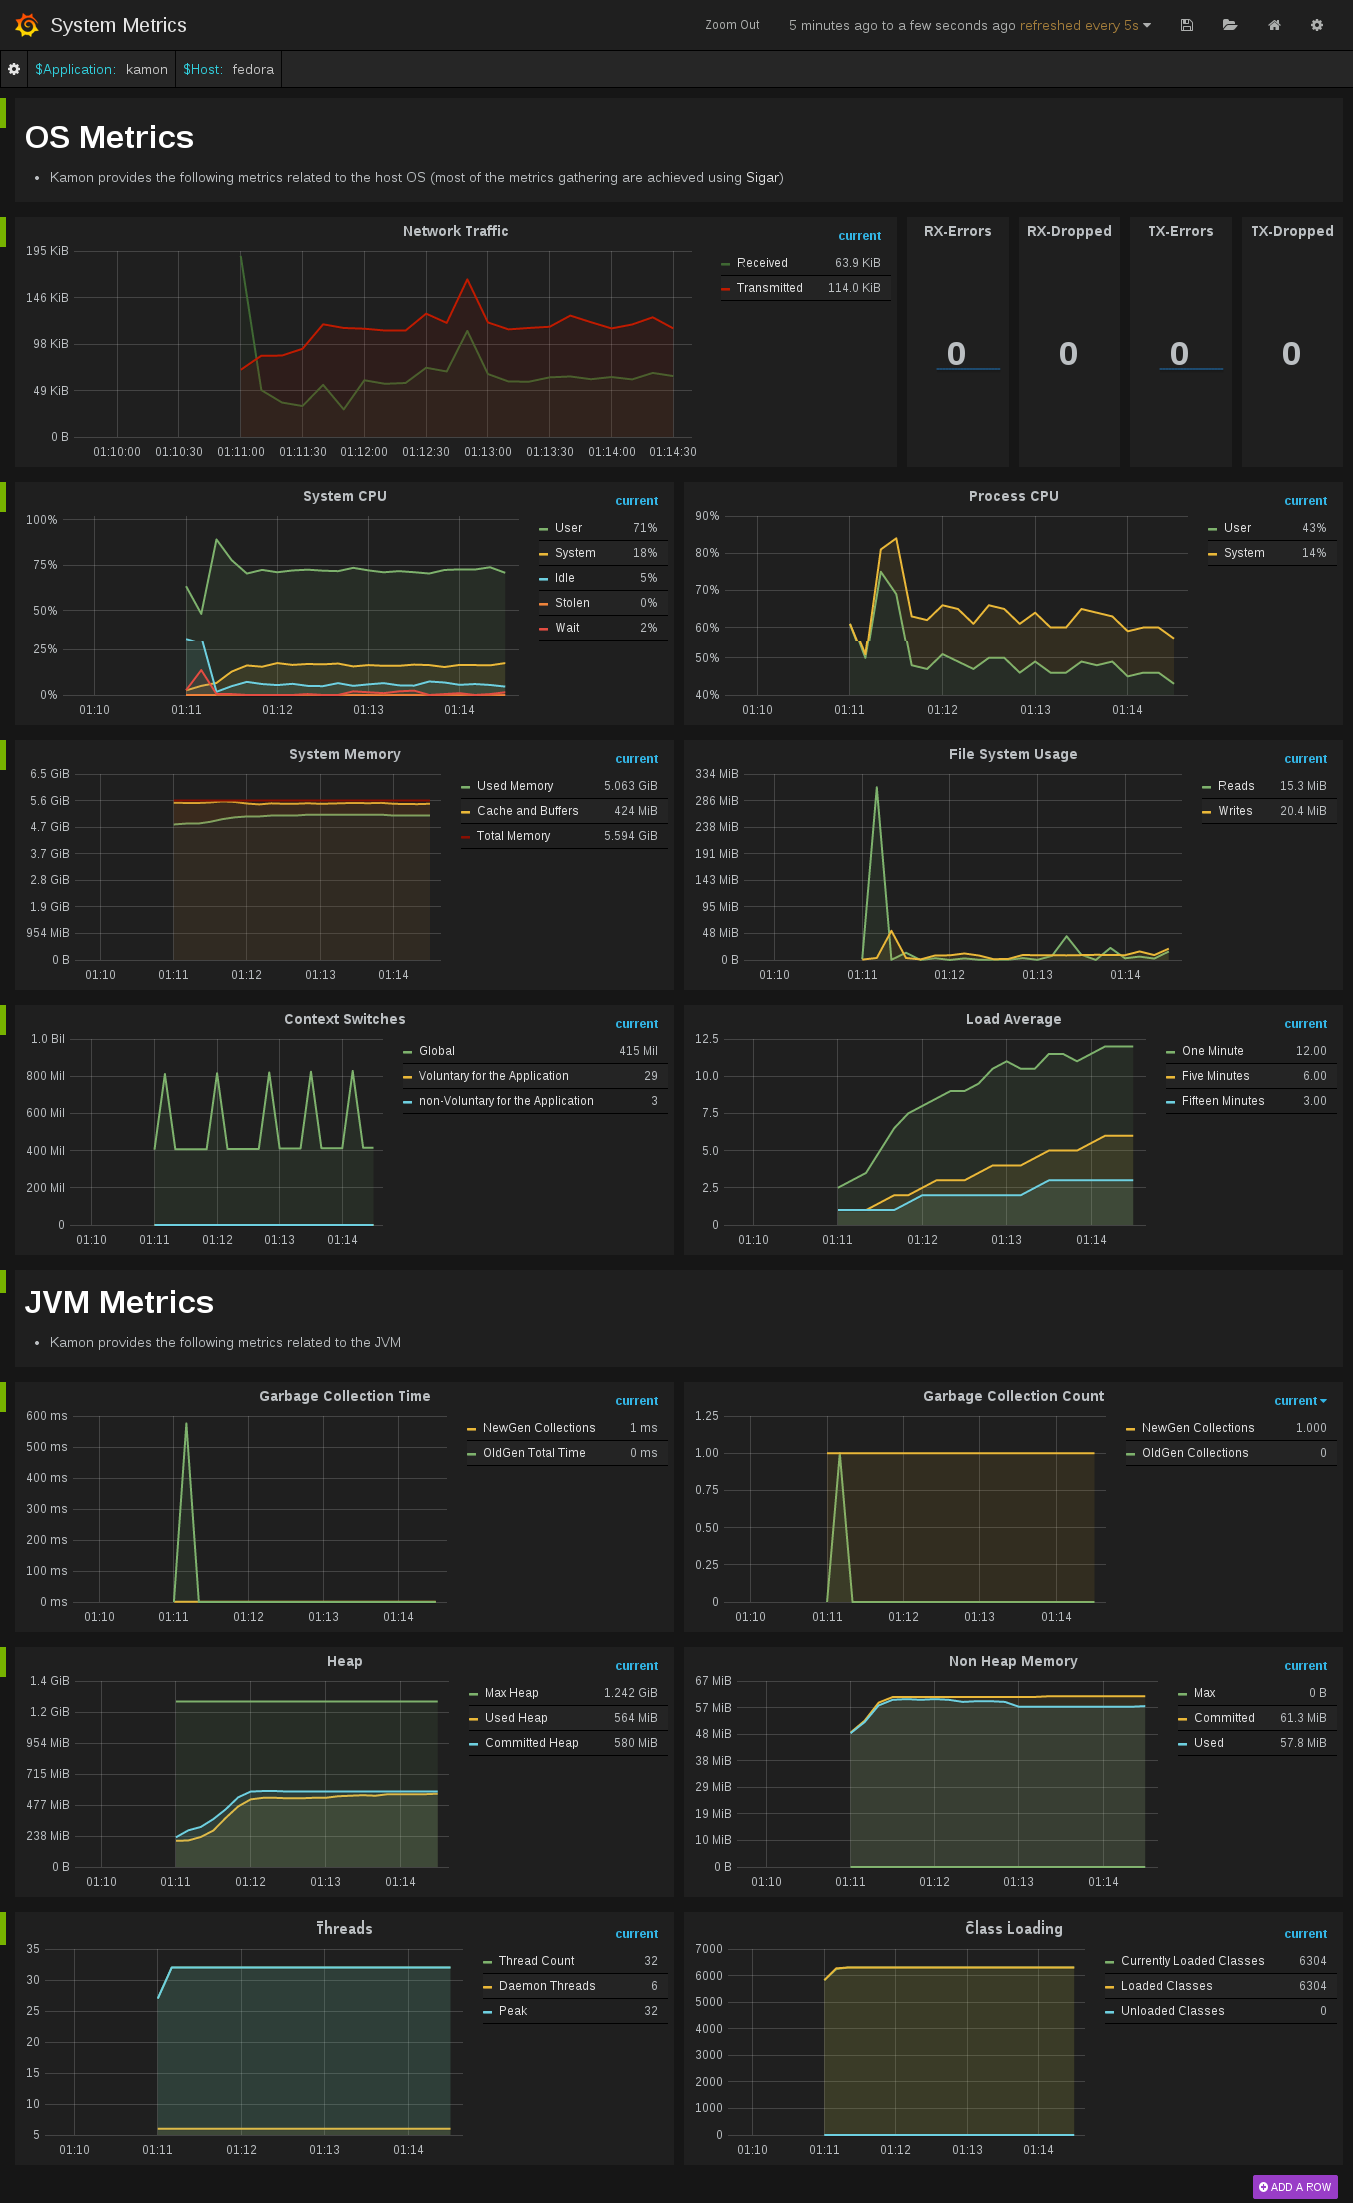
We hope that you have a lot of fun with this image and that it serves it's
purpose of making your life easier. This should give you an idea of how the dashboard looks like when receiving data
from one of our toy applications: