https://github.com/katelyndiaz/ggRtsy
For when your ggplot can use a bit more art; add some Van Gogh!
https://github.com/katelyndiaz/ggRtsy
color-palette ggplot2 r visualization
Last synced: about 1 year ago
JSON representation
For when your ggplot can use a bit more art; add some Van Gogh!
- Host: GitHub
- URL: https://github.com/katelyndiaz/ggRtsy
- Owner: katelyndiaz
- Created: 2022-03-10T16:26:12.000Z (over 4 years ago)
- Default Branch: main
- Last Pushed: 2024-03-14T18:11:57.000Z (over 2 years ago)
- Last Synced: 2024-11-13T23:32:24.330Z (over 1 year ago)
- Topics: color-palette, ggplot2, r, visualization
- Language: R
- Homepage:
- Size: 802 KB
- Stars: 2
- Watchers: 1
- Forks: 3
- Open Issues: 0
-
Metadata Files:
- Readme: README.Rmd
Awesome Lists containing this project
- awesome-ggplot2 - ggRtsy
README
---
output: github_document
---
```{r, include = FALSE}
knitr::opts_chunk$set(
collapse = TRUE,
comment = "#>"
)
```
# ggRtsy 
[](https://github.com/katelyndiaz/ggRtsy/actions/workflows/R-CMD-check.yaml)
[](https://github.com/katelyndiaz/ggRtsy/actions/workflows/r.yml)
[
[](https://CRAN.R-project.org/package=ggRtsy)
### Overview
The 'ggRtsy' package works with 'ggplot2' to add an additional color palette to the user’s repertoire. This is the `goghColors` dataset, which contains the RGB and hex codes of colors picked from Van Gogh paintings. It has been broken down into an easy-to-use color palette based on Van Gogh's most famous paintings, in the `gogh_palettes_pop` list.
#### Functions within the package:
It also has a function that work alongside ggplot to create more interesting data visualizations and add contextual information to the user’s plots.
- RectangleFiller() - divides data visualizations into a specified number of colored quadrants based on the number of input colors, improving the readability of graphs.
- scale_color_gogh() - used to color the point/lines of your ggplot
- scale_fill_gogh() - used to fill the inner color/bars of your ggplot
- rgbToHeX() - used to convert rgb color codes to hex color codes
- gogh_interpolate() - interpolates between the colors in `gogh_palettes_pop`
### Usage example
```{r, include=FALSE}
# Hidden chunk because it is setup for example
library(dplyr)
library(ggplot2)
library(ggRtsy)
library(purrr)
exampleData <- starwars %>%
filter(mass < 1000)
plotExample <- ggplot(exampleData, aes(x = height, y = mass)) +
geom_point() +
scale_x_continuous()
```
Using Hex Codes from the dataset `goghColors`, three colors were added on top of a ggplot() sample scatter plot. Based on the plot, the function automatically calculated three equal widths of the rectangles, and stretched them to upper and lower bounds on the y-axis.
```{r ex1, warning=FALSE}
RectangleFiller(plotExample, c("#e32636", "#9966cc", "#f4c2c2"))
```
#### Continuous scale_color_gogh() example using the `cafeTerrace` color palette:
```{r ex2, warning=FALSE, message=FALSE}
ggplot(exampleData, aes(x = height, y = mass, color = birth_year)) +
geom_point(size = 3) +
scale_color_gogh(palette = "cafeTerrace", discrete = FALSE, reverse = TRUE) +
theme_minimal()
```
#### Discrete scale_fill_gogh() example using the `almondBlossoms` color palette:
```{r ex3, warning=FALSE, message=FALSE}
ggplot(storms, aes(x = category, fill = status)) +
geom_bar() +
scale_fill_gogh(palette = "almondBlossoms", discrete = TRUE, reverse = FALSE) +
theme_minimal()
```
This package also comes with rgbToHex(), converting rgb colors into hex code colors.
```{r}
rgbToHex(c("(225, 104, 39)", "(60, 90, 202)"))
```
### Installation instructions
Get the development version from GitHub:
```{r, message=FALSE, eval=FALSE}
# Install remotes if needed:
# install.packages("remotes")
remotes::install_github("katelyndiaz/ggRtsy")
```
And load it with
```{r}
library(ggRtsy)
```
### Palettes
`starryNight` = '#23338C', '#30478C', '#5377A6', '#BDBF7E', '#BFA72C'
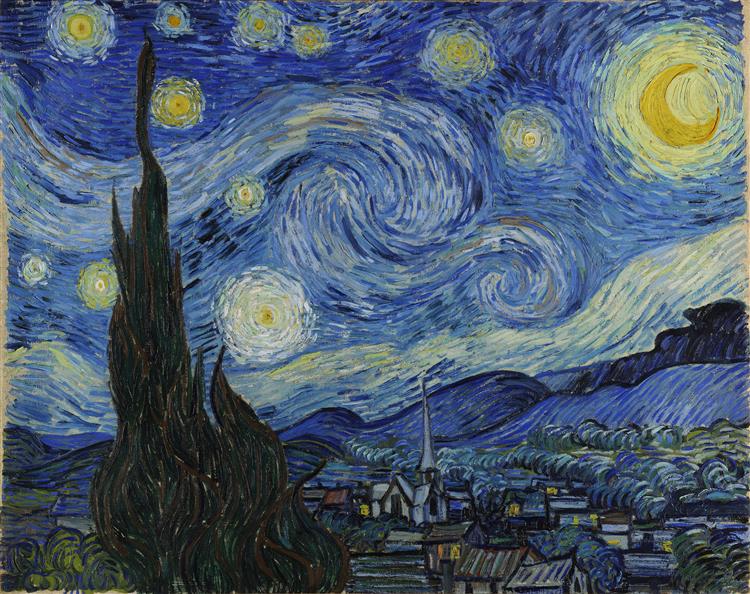{width=400px}
`sunflowers` = '#74A629', '#F2EB80', '#F2E085', '#BF9821', '#A6681C'
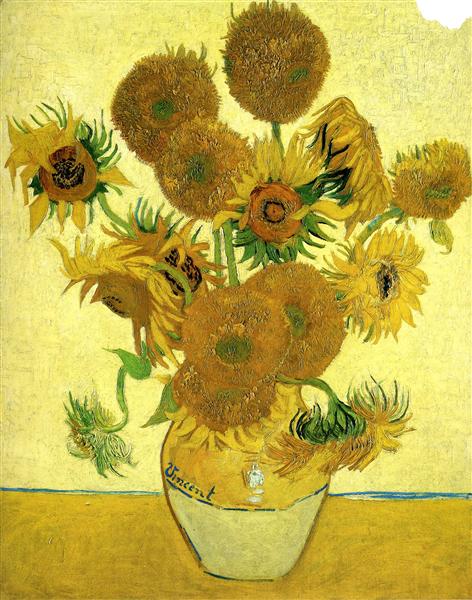{width=400px}
`selfPortrait` = '#021F59', '#63A5BF', '#8C701C', '#BF9B6F', '#730202'
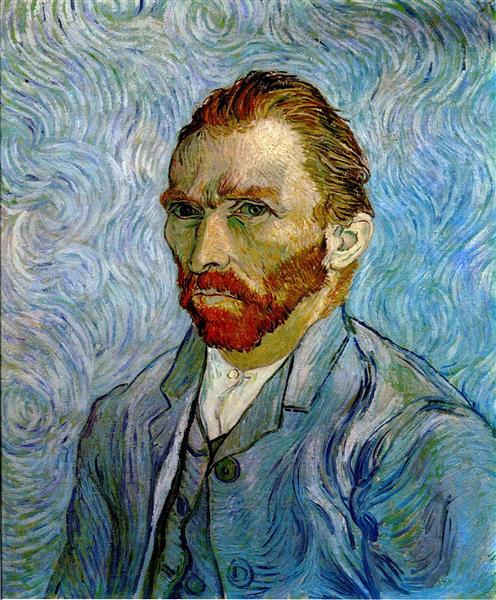{width=400px}
`wheatField` = '#73A9D9', '#477332', '#D9B13B', '#D98E32', '#A66329'
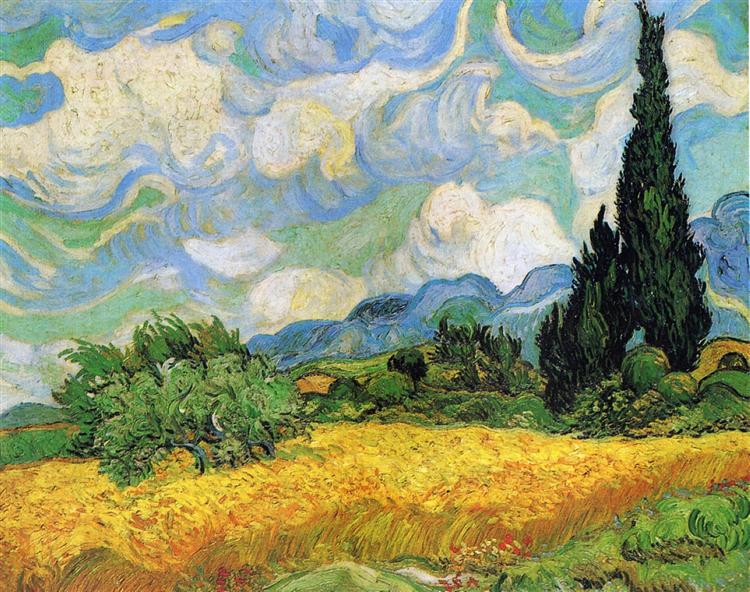{width=400px}
`cafeTerrace` = '#2A6BBF', '#3F6CA6', '#F2C84B', '#D99036', '#BF6734'
.jpg!Large.jpg){width=400px}
`rhoneStarry` = '#073359', '#27668C', '#5A98BF', '#60734D', '#A3A658'
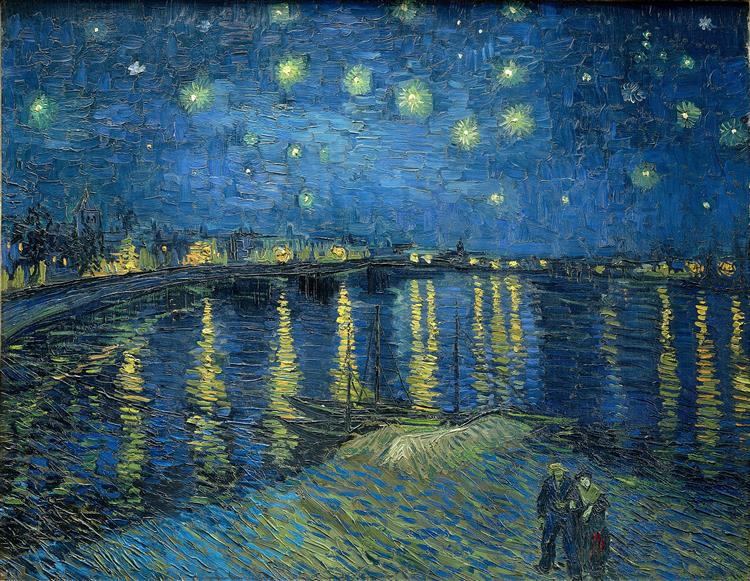{width=400px}
`irises` = '#415AA6', '#6382BF', '#65A67C', '#8CA653', '#A66D58'
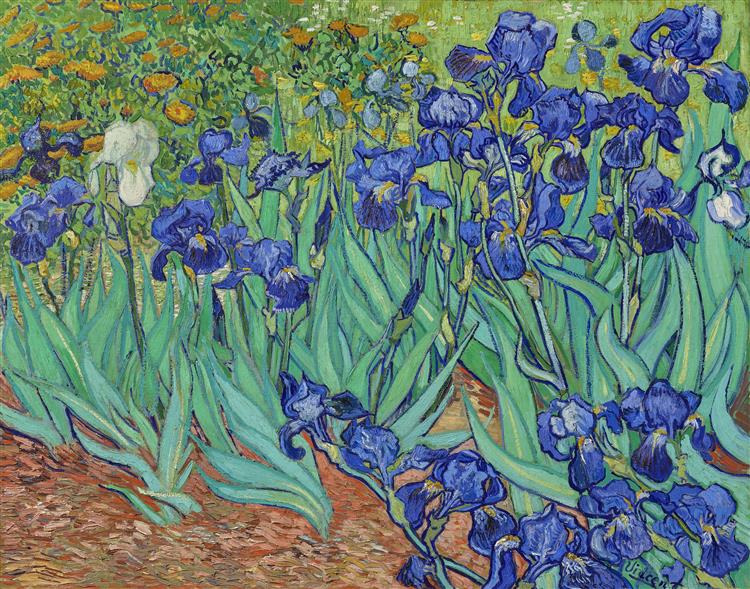{width=400px}
`almondBlossoms` = '#236E8C', '#20788C', '#49B3BF', '#41BFBF', '#BDBF75'
.jpg!Large.jpg){width=400px}
### See also
* [tayloRswift package](https://github.com/asteves/tayloRswift)