https://github.com/kcuilla/reactablefmtr
Streamlined Table Styling and Formatting for Reactable
https://github.com/kcuilla/reactablefmtr
customization data-visualization easy-to-use r r-package reproducible rstats tables
Last synced: 10 months ago
JSON representation
Streamlined Table Styling and Formatting for Reactable
- Host: GitHub
- URL: https://github.com/kcuilla/reactablefmtr
- Owner: kcuilla
- License: other
- Created: 2021-02-05T16:29:42.000Z (over 5 years ago)
- Default Branch: main
- Last Pushed: 2024-03-16T14:50:51.000Z (over 2 years ago)
- Last Synced: 2024-11-12T22:48:21.968Z (over 1 year ago)
- Topics: customization, data-visualization, easy-to-use, r, r-package, reproducible, rstats, tables
- Language: R
- Homepage: https://kcuilla.github.io/reactablefmtr/
- Size: 27.7 MB
- Stars: 208
- Watchers: 9
- Forks: 27
- Open Issues: 38
-
Metadata Files:
- Readme: README.md
- License: LICENSE
Awesome Lists containing this project
- awesome-shiny-extensions - reactablefmtr - Simplify the styling, formatting, and customization of tables made with reactable. (UI Components / Table)
- jimsghstars - kcuilla/reactablefmtr - Streamlined Table Styling and Formatting for Reactable (R)
README
## reactablefmtr 
[](https://cran.r-project.org/package=reactablefmtr?color=blue)
[](https://cranlogs.r-pkg.org/badges/grand-total/reactablefmtr?color=brightgreen)
The {reactablefmtr} package streamlines and enhances the styling and formatting of tables built with the {reactable} **R** package. The {reactablefmtr} package provides many conditional formatters that are highly customizable and easy to use.
* **Conditionally format tables** with [color scales](https://kcuilla.github.io/reactablefmtr/articles/color_scales.html), [color tiles](https://kcuilla.github.io/reactablefmtr/articles/color_tiles.html), and [data bars](https://kcuilla.github.io/reactablefmtr/articles/data_bars.html). Assign icons from [Font Awesome](https://fontawesome.com/icons?d=gallery&p=2) with [icon assign](https://kcuilla.github.io/reactablefmtr/articles/icon_assign.html) and [icon sets](https://kcuilla.github.io/reactablefmtr/articles/icon_sets.html).
* **Interactive sparklines** that are highly [customizable](https://kcuilla.github.io/reactablefmtr/articles/sparklines.html) and available in line or bar format.
* **Custom table themes** that can [easily](https://kcuilla.github.io/reactablefmtr/articles/themes.html) be applied to any {reactablefmtr} or {reactable} table.
* **Embed images** directly from the web into your table.
* **Save tables** as static PNG files or as interactive HTML files.
For more examples, check out the [vignettes](https://kcuilla.github.io/reactablefmtr/articles/). To stay up to date with the latest upgrades to the development version, be sure to follow the package [news](https://kcuilla.github.io/reactablefmtr/news/index.html).
## Installation
The {reactablefmtr} package is available from CRAN and can be installed with:
```{r}
install.packages("reactablefmtr")
```
Or install the development version of {reactablefmtr} with:
```{r}
remotes::install_github("kcuilla/reactablefmtr")
```
## Why reactablefmtr?
The {reactable} package allows for the creation of interactive data tables in R. However, styling tables within {reactable} requires a lot of code, can be difficult for many R users (due to the need to understand HTML and CSS), and not scalable. For example, here is the current method of creating bar charts within {reactable}:
```{r}
library(reactable)
library(htmltools)
data <- MASS::Cars93[20:49, c("Make", "MPG.city", "MPG.highway")]
bar_chart <- function(label, width = "100%", height = "16px", fill = "#15607A", background = "#EEEEEE") {
bar <- div(style = list(background = fill, width = width, height = height))
chart <- div(style = list(flexGrow = 1, marginLeft = "8px", background = background), bar)
div(style = list(display = "flex", alignItems = "center"), label, chart)
}
reactable(
data,
columns = list(
MPG.city = colDef(align = "left", cell = function(value) {
width <- paste0(value / max(data$MPG.city) * 100, "%")
bar_chart(value, width = width)
}),
MPG.highway = colDef(align = "left", cell = function(value) {
width <- paste0(value / max(data$MPG.highway) * 100, "%")
bar_chart(value, width = width)
})
)
)
```
The {reactablefmtr} package presents a much simpler method of creating bar charts with the `data_bars()` function. In addition to needing far less code, there are also a multitude of customization options available to easily change the appearance of the bar charts, and as an added bonus, the bars animate on sort!
```{r}
library(reactablefmtr)
reactable(
data,
defaultColDef = colDef(
cell = data_bars(data, text_position = "outside-base")
)
)
```
## Examples
### Data Bars
Use `data_bars()` to assign horizontal bars to each row. There are many ways to [customize](https://kcuilla.github.io/reactablefmtr/reference/data_bars.html) the look of `data_bars()`, including the alignment of the bars, the position of the text labels, and the option to add icons and images to the bars. See the [tutorial](https://kcuilla.github.io/reactablefmtr/articles/data_bars.html) for customization examples.
### Sparklines
Use `react_sparkline()` to create sparklines or `react_sparkbar()` to create sparkline bar charts. The sparklines are highly customizable and interactive. As you hover over each data point, the value will appear. The sparklines are imported from the [{dataui}](https://timelyportfolio.github.io/dataui/index.html) package, so this package will need to be downloaded from GitHub in order to use this feature.
### Color Scales
Use `color_scales()` to assign conditional colors to cells based on their relative values. The color of the text in the cells automatically adjusts based on the shade of the cell color, allowing the use of dark-colored palettes. See the [tutorial](https://kcuilla.github.io/reactablefmtr/articles/color_scales.html) for more examples.
### Bubble Grids
Bubble grid tables can be created using `bubble_grid()`. Bubbles can be shown as circles or squares using the `shape` parameter. To see how the example below was created, please check out the [bubble grids](https://kcuilla.github.io/reactablefmtr/articles/reactablefmtr_cookbook.html#adjust-size-of-bubbles) section in the {reactablefmtr} cookbook:
## Custom Themes
Within {reactablefmtr}, there are 24+ custom table themes. The themes include [bootstrap](https://bootswatch.com/) themes, themes inspired by news/sports sites such as The New York Times, FiveThirtyEight, and ESPN, as well as other custom themes that can only be found within {reactablefmtr}. The themes can be applied easily to tables by simply referencing the theme name. Additional customization options, such as changing the font size, font color, etc. are also [available](https://kcuilla.github.io/reactablefmtr/articles/themes.html).
An example of the fivethirtyeight() theme:
## Using with Crosstalk or Shiny
{reactablefmtr} works well when linked to UI controls via [{crosstalk}](https://rstudio.github.io/crosstalk/using.html) or within a Shiny app.
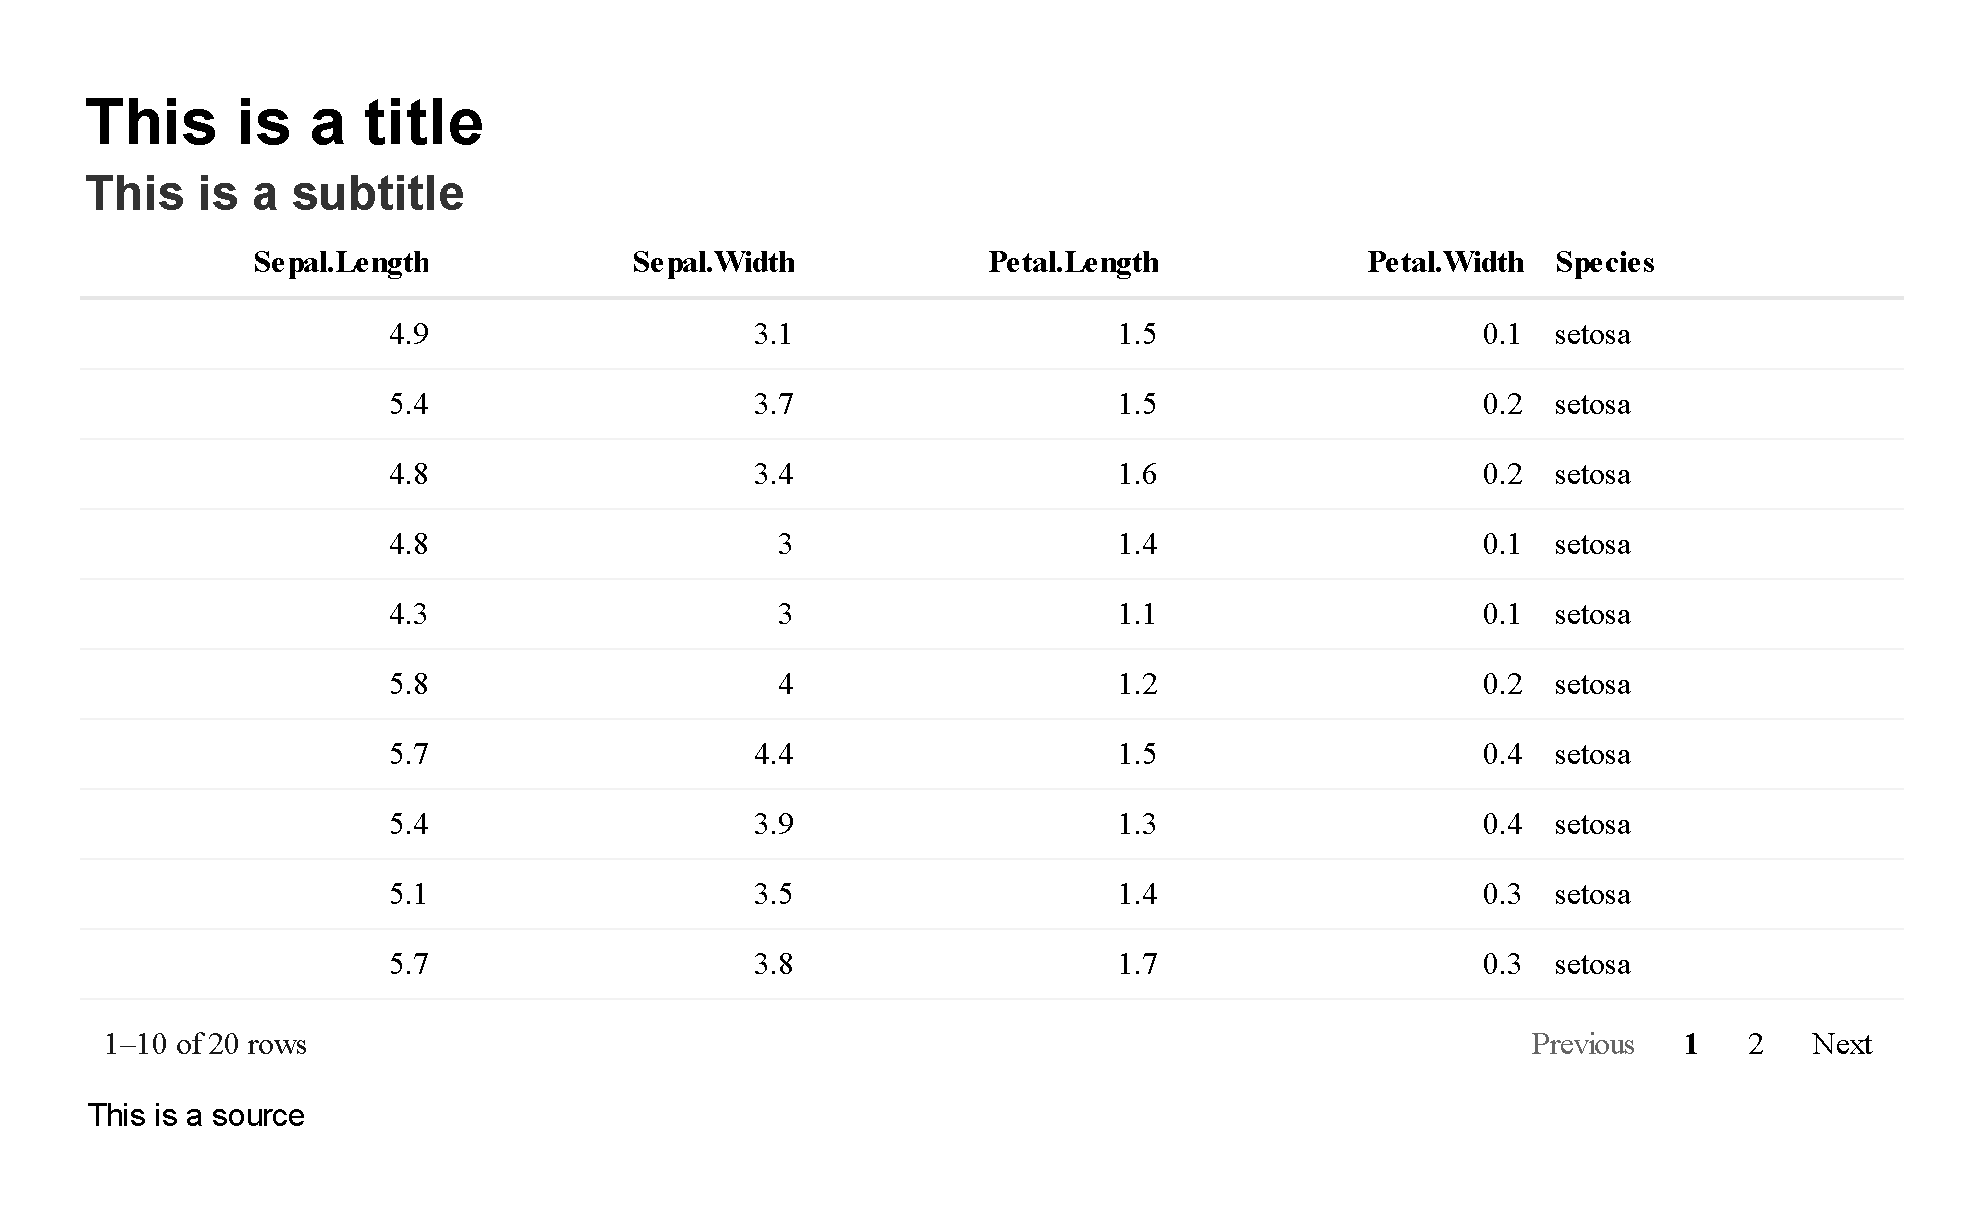
## Add a Title, Subtitle, and Source
Titles and subtitles can be easily placed above any {reactablefmtr} or {reactable} table with `add_title()` and `add_subtitle()`. Also have the option to include a source below a table with `add_source()`. Additional customization options such as changing the alignment, font size, font family, font style, and font color are available within each formatter.
```{r}
reactable(iris[10:29, ]) %>%
add_title("This is a title") %>%
add_subtitle("This is a subtitle") %>%
add_source("This is a source")
```
## Create Data Visualizations
Who says {reactablefmtr} can just be used to make tables? You can create data visualizations like the one shown below. [Source code](https://github.com/kcuilla/Tidy-Tuesday/blob/main/2021_26/park_spending.R)
## Save Static or Interactive Tables
{reactablefmtr} or {reactable} tables can be saved directly to a file as a static PNG image or as an interactive HTML file with `save_reactable()`.
Save as a PNG file:
```{r}
save_reactable(table_name, "table.png")
```
Save as an HTML file:
```{r}
save_reactable(table_name, "table.html")
```
If custom CSS styling is applied to the table within an R Markdown document:
```{r}
save_reactable("table_name.Rmd", "table.png")
```
If you prefer to use a pipe:
```{r}
table_name %>%
save_reactable("table.png")
```
## Additional Resources
A presentation given to the SoCal R Users Group:
https://rpubs.com/kcuilla/reactablefmtr-socal-presentation
## Acknowledgments & Contributions
* A huge thank you to Greg Lin for creating the amazing [{reactable}](https://glin.github.io/reactable/index.html) package! Without Greg, {reactablefmtr} simply would not exist!
* Thank you to Kent Russell for putting together the wonderful [{dataui}](https://timelyportfolio.github.io/dataui/index.html) package and suggesting integrating the code with {reactablefmtr} to allow interactive sparkline customization in reactable tables.
* Last but not least, thank you to those below who have contributed to the development and/or documentation of the package! [@yjunechoe](https://github.com/yjunechoe), [@shannonpileggi](https://github.com/shannonpileggi), [@TimTeaFan](https://github.com/TimTeaFan)