https://github.com/kegsay/matrix-vis
Matrix graph visualisation
https://github.com/kegsay/matrix-vis
Last synced: 5 days ago
JSON representation
Matrix graph visualisation
- Host: GitHub
- URL: https://github.com/kegsay/matrix-vis
- Owner: kegsay
- License: apache-2.0
- Created: 2015-01-04T16:31:57.000Z (over 10 years ago)
- Default Branch: master
- Last Pushed: 2016-04-07T09:50:36.000Z (over 9 years ago)
- Last Synced: 2025-04-03T01:51:09.344Z (3 months ago)
- Language: JavaScript
- Size: 1.29 MB
- Stars: 5
- Watchers: 3
- Forks: 0
- Open Issues: 0
-
Metadata Files:
- Readme: README.md
- License: LICENSE
Awesome Lists containing this project
- awesome-starred - kegsay/matrix-vis - Matrix graph visualisation (others)
README
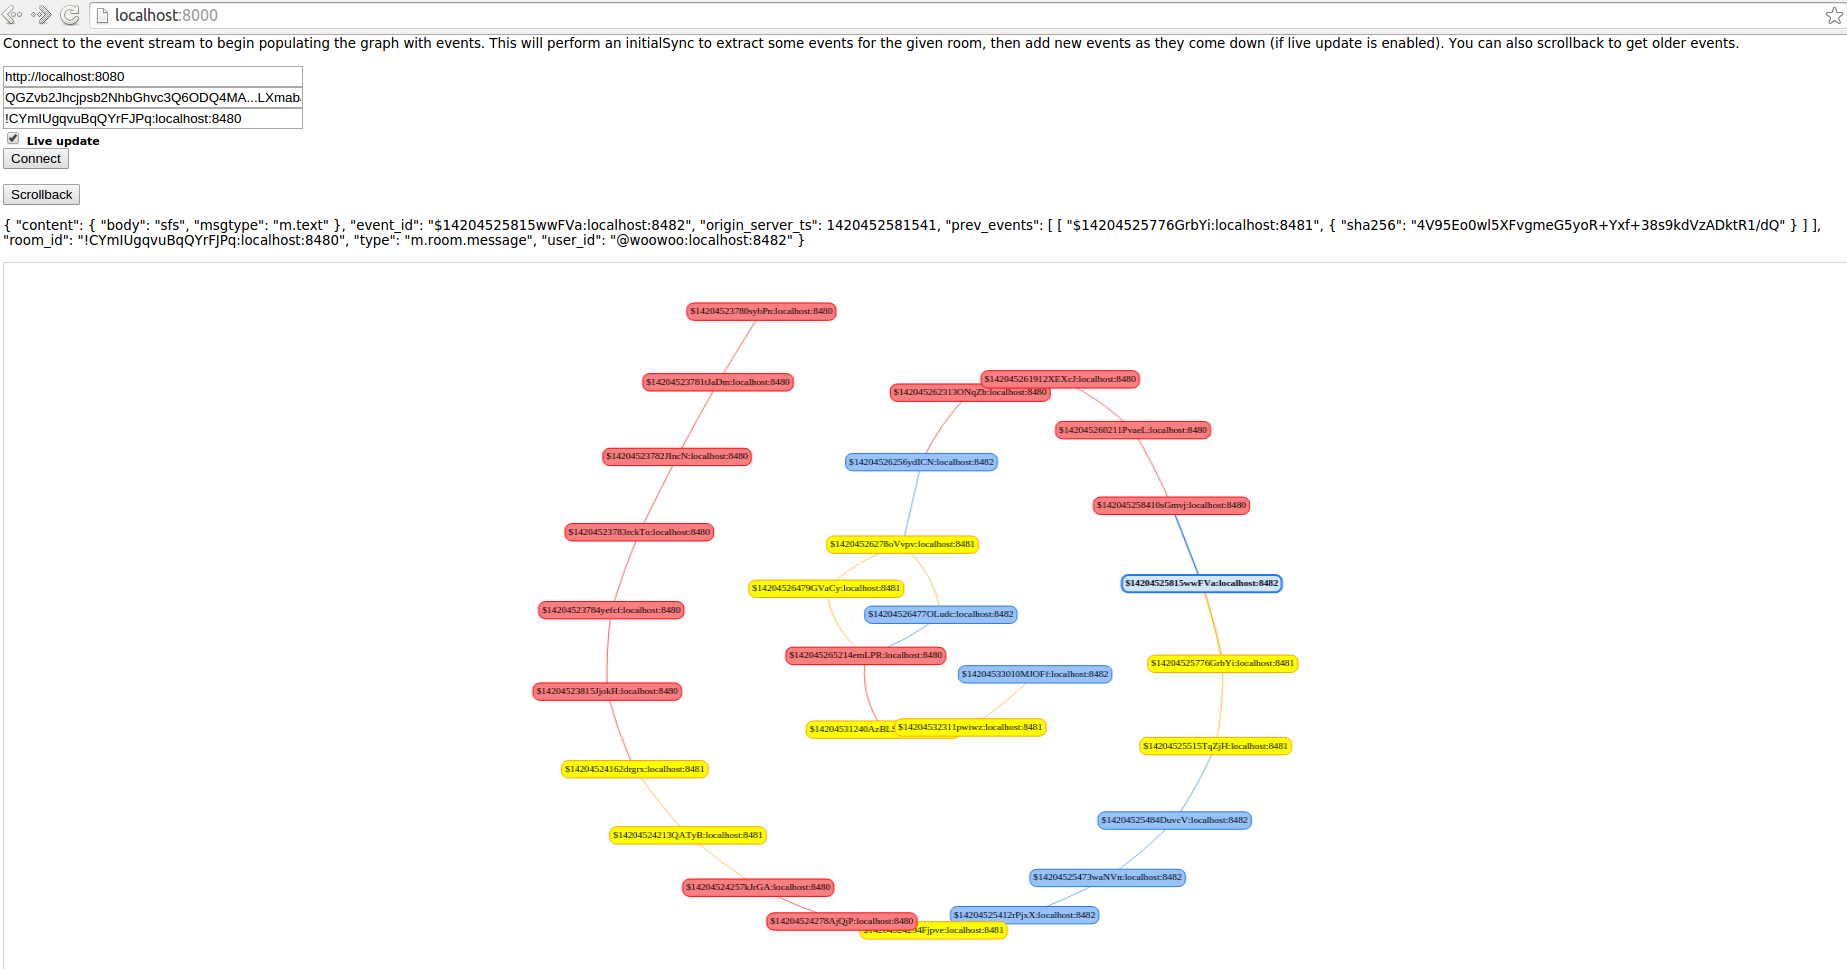
This script visualises the graph formed by Matrix events in a room.

Features:
- Displays the event graph for a room visually.
- Display individual event JSON when selected.
- Can read from the event stream to add new events to the graph in realtime.
- Can perform scrollback on a room to collect earlier events (up to the root)
- Different node colours for different servers.
Requires:
- "npm install vis"
Usage:
- Host this folder (e.g. ``python -m SimpleHTTPServer``)
- Visit index.html and enter in your information.
Assumptions:
- Event IDs are formatted as ``blob:domain`` (for colouring nodes based on domain).