https://github.com/keilerkonzept/sliding-topk-tui-demo
Demo app for the https://github.com/keilerkonzept/topk sliding top-k sketch library
https://github.com/keilerkonzept/sliding-topk-tui-demo
heavy-hitters heavy-keeper heavykeeper sketch sliding-window terminal-plot time-series top-k tui
Last synced: about 1 month ago
JSON representation
Demo app for the https://github.com/keilerkonzept/topk sliding top-k sketch library
- Host: GitHub
- URL: https://github.com/keilerkonzept/sliding-topk-tui-demo
- Owner: keilerkonzept
- License: mit
- Created: 2024-09-23T17:34:20.000Z (7 months ago)
- Default Branch: main
- Last Pushed: 2025-02-12T23:52:31.000Z (2 months ago)
- Last Synced: 2025-02-13T00:29:50.694Z (2 months ago)
- Topics: heavy-hitters, heavy-keeper, heavykeeper, sketch, sliding-window, terminal-plot, time-series, top-k, tui
- Language: Go
- Homepage:
- Size: 3.61 MB
- Stars: 2
- Watchers: 0
- Forks: 0
- Open Issues: 0
-
Metadata Files:
- Readme: README.md
- License: LICENSE
Awesome Lists containing this project
README
        # sliding-topk-tui-demo

This is a demo app for the  library (specifically, the [`sliding`](https://pkg.go.dev/github.com/keilerkonzept/topk/sliding) package).

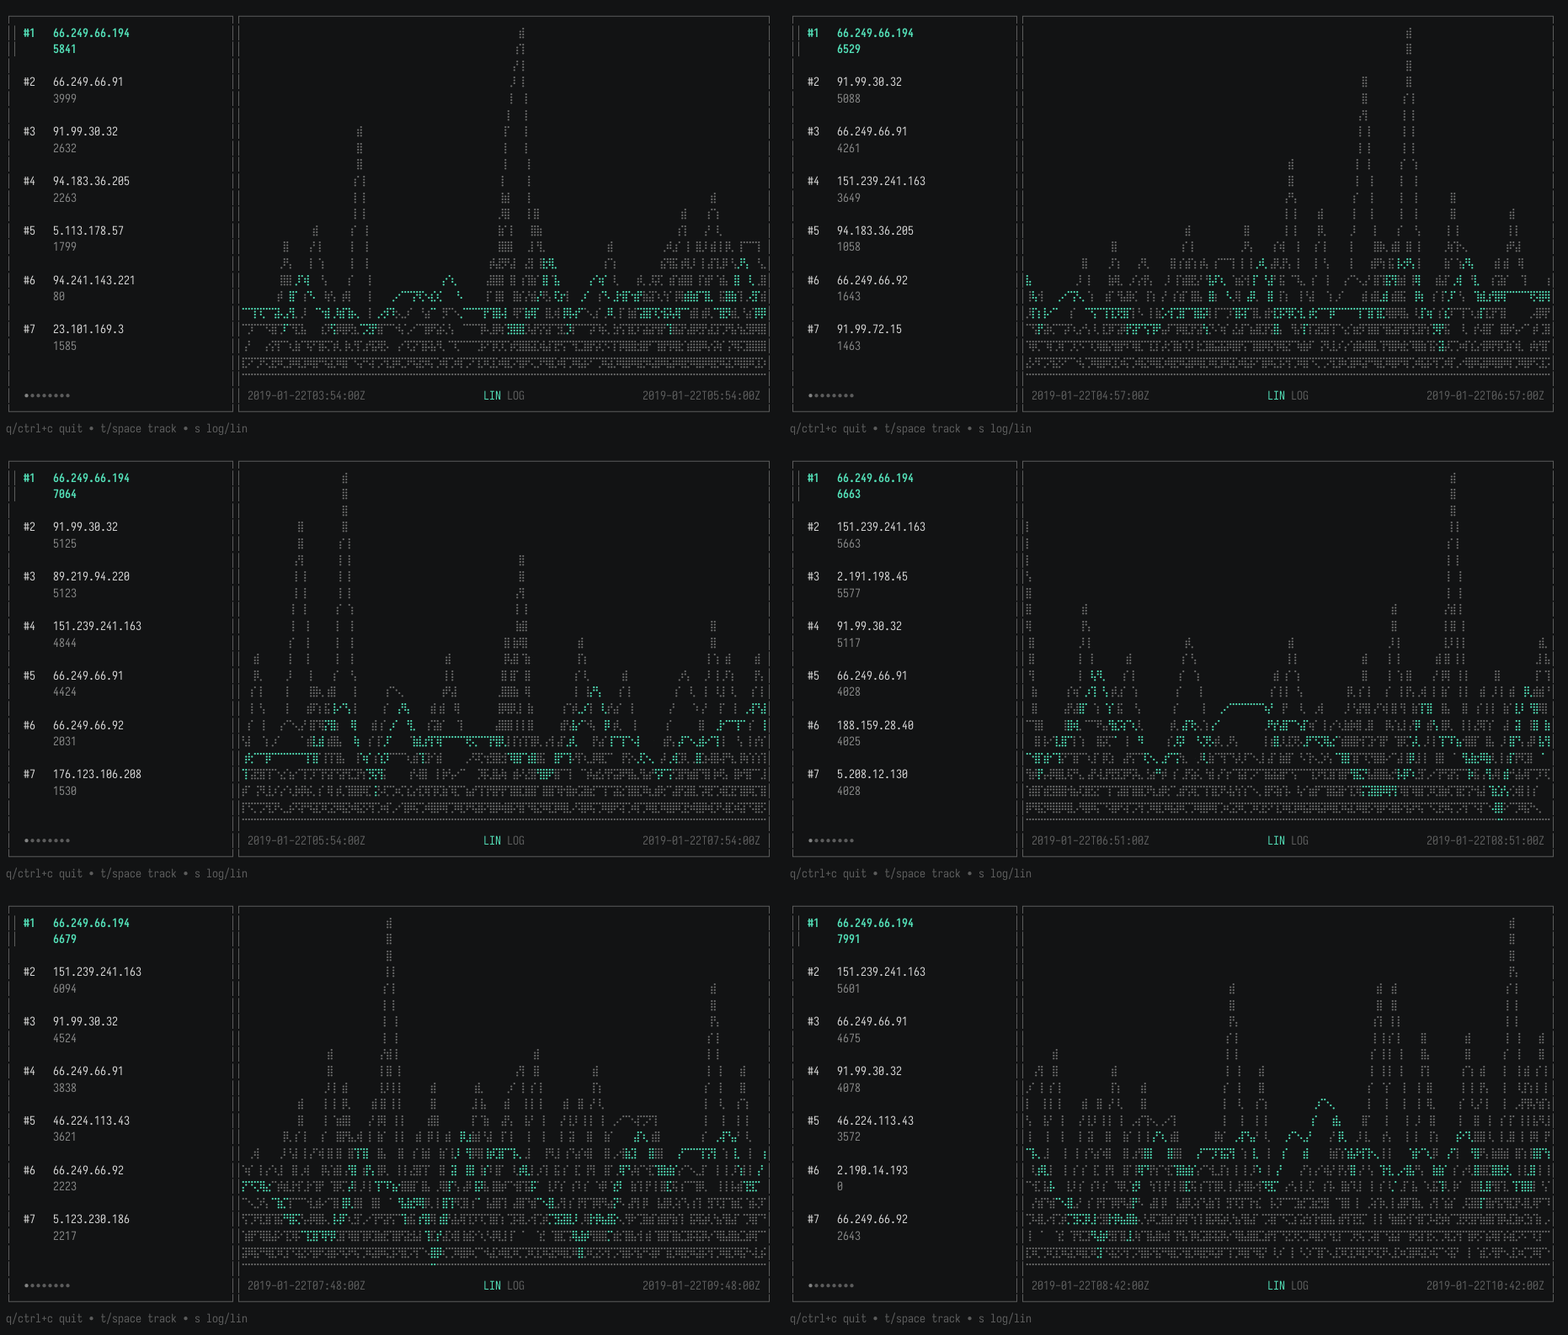
The app is a real-time TUI leaderboard visualising sliding-window counts for items read from standard input. It shows a list of top-k items and a time series plot of the sliding window contents showing per-tick counters for each item..

**Contents**

- [Access logs example](#access-logs-example)

- [Getting it](#getting-it)

- [What it does](#what-it-does)

- [How it works](#how-it-works)

- [Usage](#usage)

  - [Command-line options](#command-line-options)

  - [Example usage](#example-usage)

  - [Input Formats](#input-formats)

    - [Text Mode](#text-mode)

    - [JSON Mode](#json-mode)

  - [Keyboard Controls](#keyboard-controls)

- [License](#license)

## Access logs example

Here, we show the top requesting IPs within a 4h sliding window from a [web server access logs dataset](https://www.kaggle.com/datasets/eliasdabbas/web-server-access-logs):


The input data looks like this:

```log

31.56.96.51 - - [22/Jan/2019:03:56:16 +0330] "GET /image/60844/productModel/200x200 HTTP/1.1" 200 5667 "https://www.zanbil.ir/m/filter/b113" "Mozilla/5.0 (Linux; Android 6.0; ALE-L21 Build/HuaweiALE-L21) AppleWebKit/537.36 (KHTML, like Gecko) Chrome/66.0.3359.158 Mobile Safari/537.36" "-"

31.56.96.51 - - [22/Jan/2019:03:56:16 +0330] "GET /image/61474/productModel/200x200 HTTP/1.1" 200 5379 "https://www.zanbil.ir/m/filter/b113" "Mozilla/5.0 (Linux; Android 6.0; ALE-L21 Build/HuaweiALE-L21) AppleWebKit/537.36 (KHTML, like Gecko) Chrome/66.0.3359.158 Mobile Safari/537.36" "-"

40.77.167.129 - - [22/Jan/2019:03:56:17 +0330] "GET /image/14925/productModel/100x100 HTTP/1.1" 200 1696 "-" "Mozilla/5.0 (compatible; bingbot/2.0; +http://www.bing.com/bingbot.htm)" "-"

...

```

...and the visualisation is generated like this:

```sh

# read gzip'ed log, transform them into {item,timestamp} JSON objects,

# and feed them to the demo app.