https://github.com/kempnerinstitute/kempnerpulse
KempnerPulse - real-time GPU monitoring dashboard for DCGM Prometheus metrics.
https://github.com/kempnerinstitute/kempnerpulse
gpu gpu-computing gpu-monitoring gpu-utilization nvidia nvidia-gpu
Last synced: 2 months ago
JSON representation
KempnerPulse - real-time GPU monitoring dashboard for DCGM Prometheus metrics.
- Host: GitHub
- URL: https://github.com/kempnerinstitute/kempnerpulse
- Owner: KempnerInstitute
- License: mit
- Created: 2026-03-30T20:33:18.000Z (3 months ago)
- Default Branch: main
- Last Pushed: 2026-04-13T22:51:26.000Z (2 months ago)
- Last Synced: 2026-04-14T00:28:39.970Z (2 months ago)
- Topics: gpu, gpu-computing, gpu-monitoring, gpu-utilization, nvidia, nvidia-gpu
- Language: Python
- Homepage:
- Size: 6.06 MB
- Stars: 7
- Watchers: 0
- Forks: 0
- Open Issues: 2
-
Metadata Files:
- Readme: README.md
- Contributing: CONTRIBUTING.md
- License: LICENSE
Awesome Lists containing this project
README
# KempnerPulse
[](https://pypi.org/project/kempnerpulse/)
> `nvidia-smi` says 100% GPU utilization - but are your tensor cores even active? KempnerPulse shows what's *actually* happening.
Real-time GPU monitoring dashboard for DCGM metrics. A single-file
Rich-based TUI that streams metrics from
[dcgm-exporter](https://github.com/NVIDIA/dcgm-exporter) via Prometheus HTTP
or directly from `dcgmi dmon` for high-resolution profiling (~100 ms),
and renders four interactive views in the terminal.
## Features
- **Fleet View** : All GPUs at a glance: utilization, memory, power,
temperature, PCIe/NVLink bandwidth, sparkline bars.
- **Focus View** : Deep dive into one GPU with per-metric sparkline history.
- **Plot View** : Stacked line charts across all GPUs.
- **Job View** : Running GPU compute processes with per-GPU metrics.
- **Real Utilization** : Weighted composite metric from SM active, tensor pipe,
DRAM active, and GR engine counters (customizable weights with presets for
AI/ML, HPC, and memory-bound workflows).
- **Workload Classification** : 12-category status based on NVIDIA DCGM
profiling metric guidance (idle, tensor-heavy compute, memory-bound, I/O,
etc.).
- **Health Monitoring** : Temperature, PCIe replay errors, and ECC errors
with color-coded alerts.
- **SLURM/CUDA Aware** : Automatically detects `CUDA_VISIBLE_DEVICES`,
`SLURM_JOB_GPUS`, etc. to show only your allocated GPUs.
- **Direct DCGM Backend** : `--backend dcgm` queries `dcgmi dmon` directly,
bypassing dcgm-exporter for true high-resolution sampling. Automatically
resolves physical GPU IDs inside SLURM cgroups.
- **Zero Dependencies** beyond Python 3.9+ and `rich`.
## Screenshots
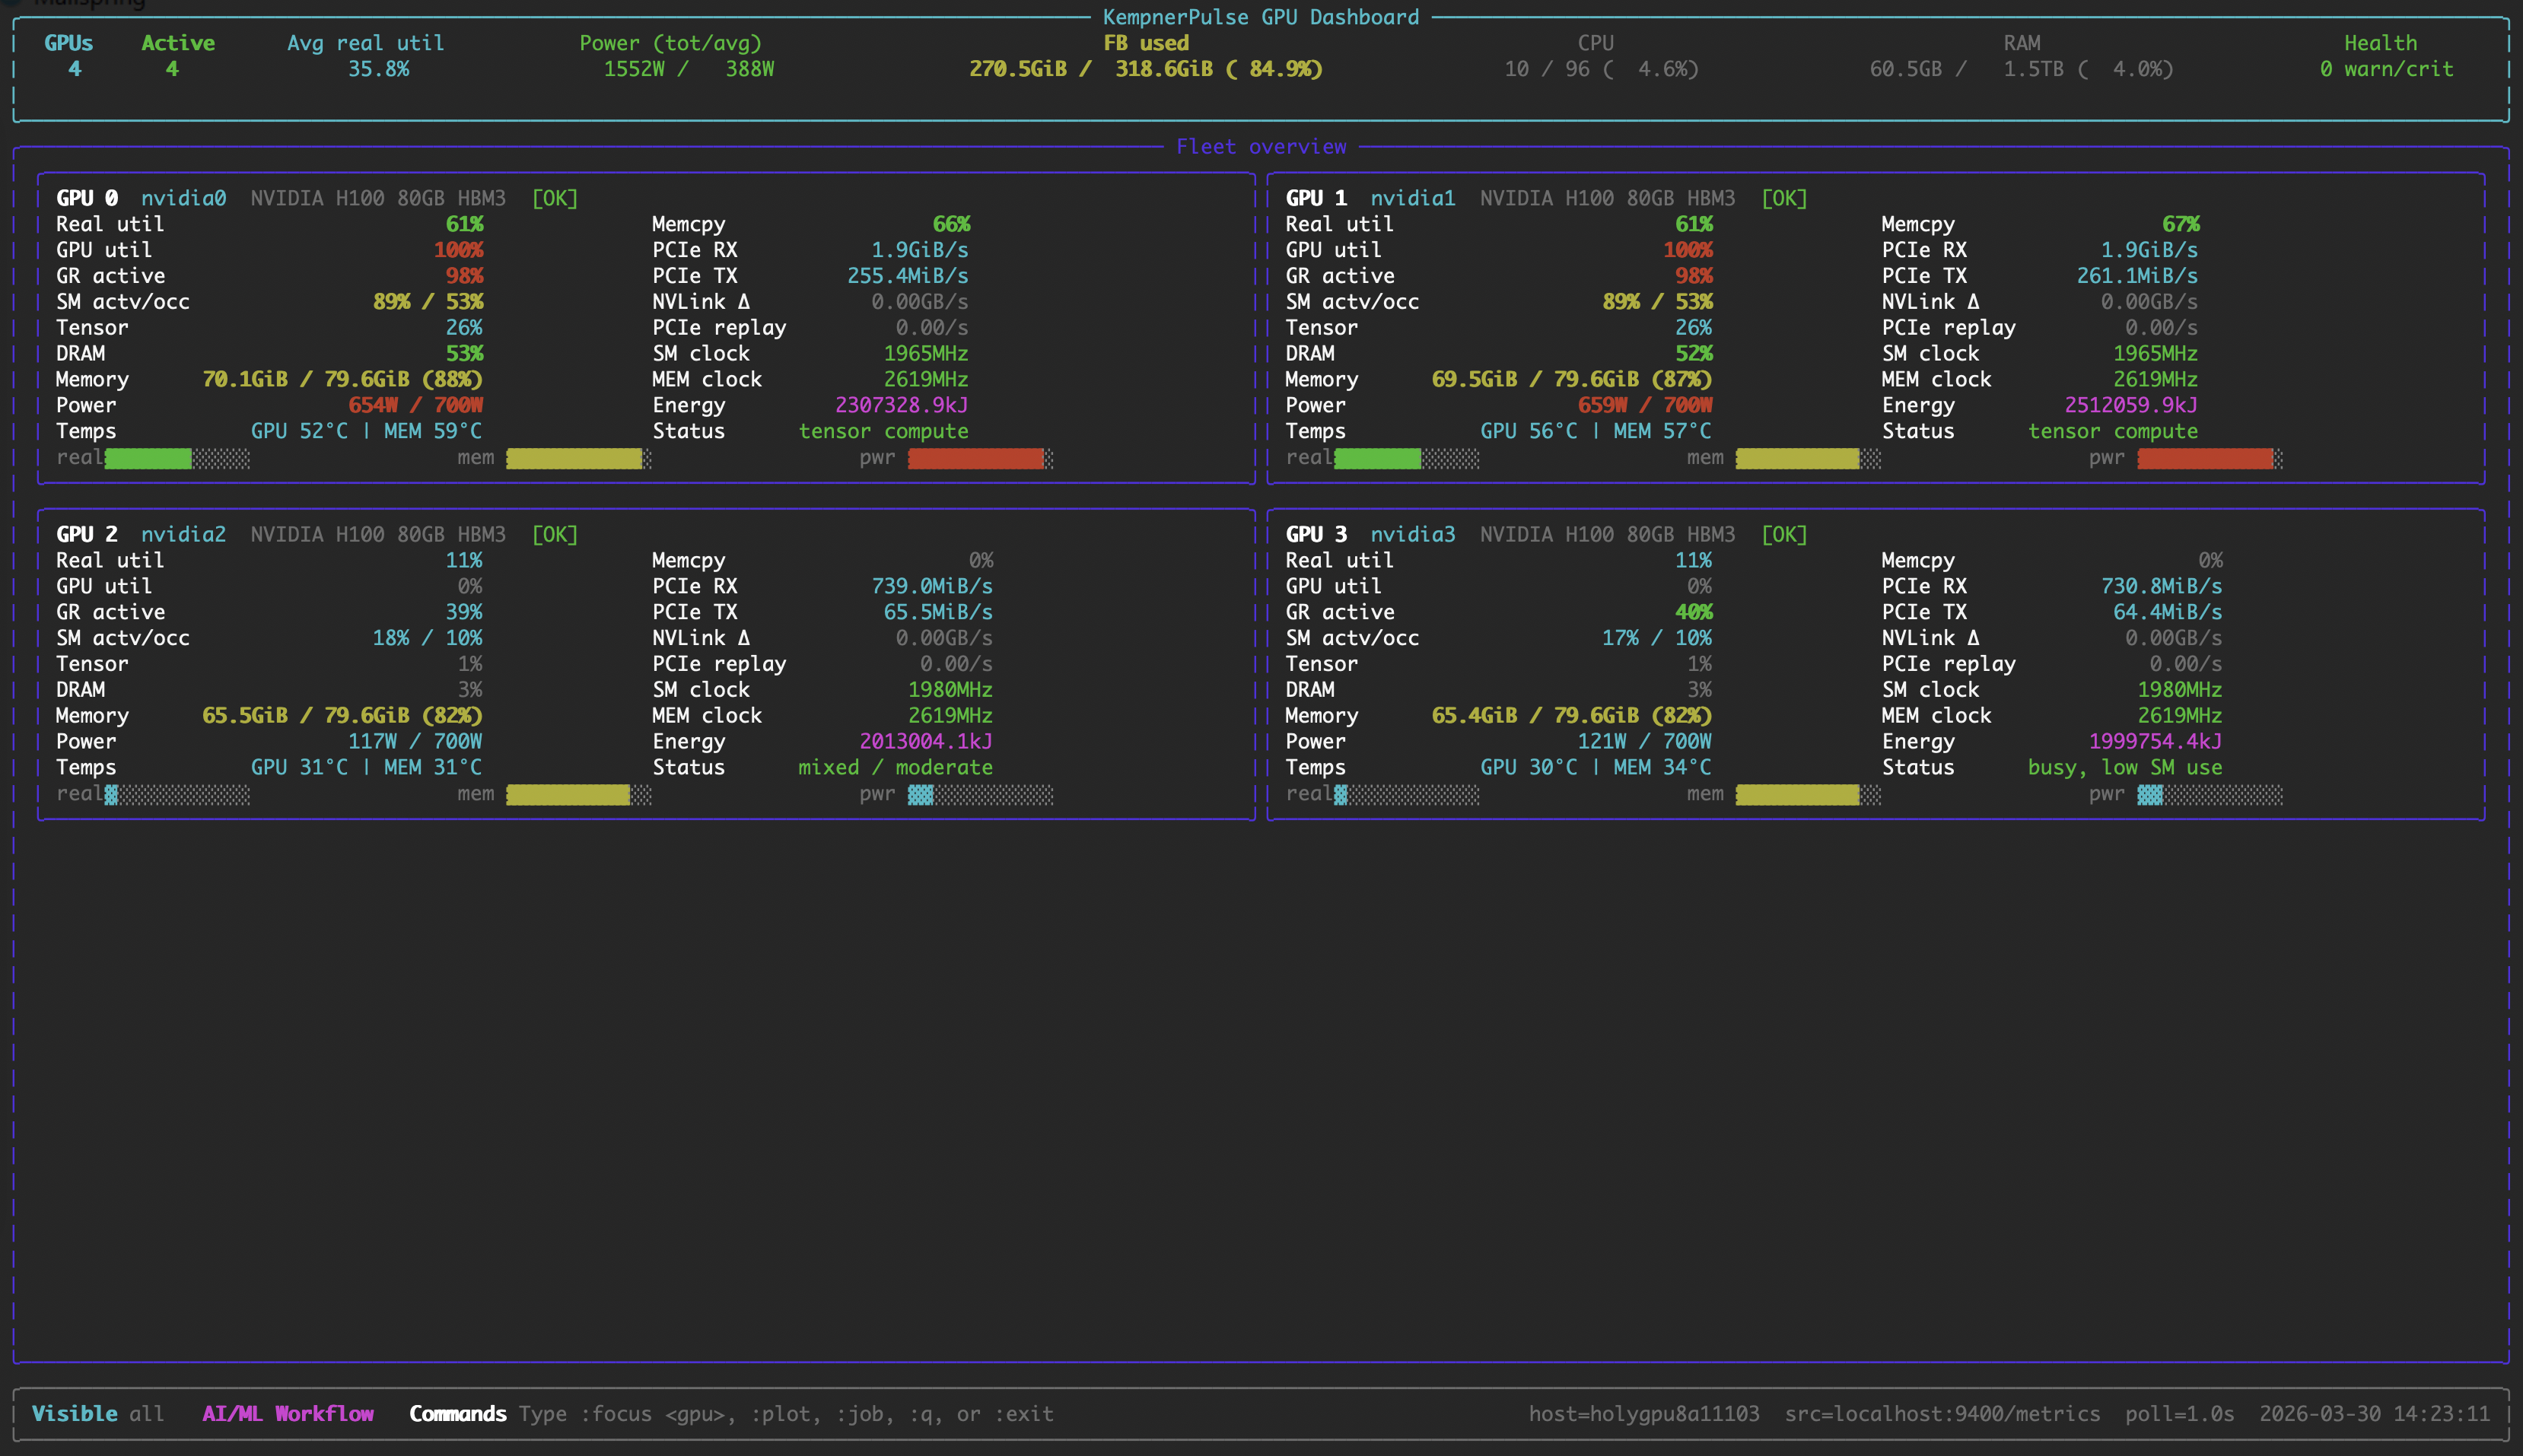
### Fleet View
All GPUs at a glance with utilization bars, memory, power, temperature, and bandwidth.
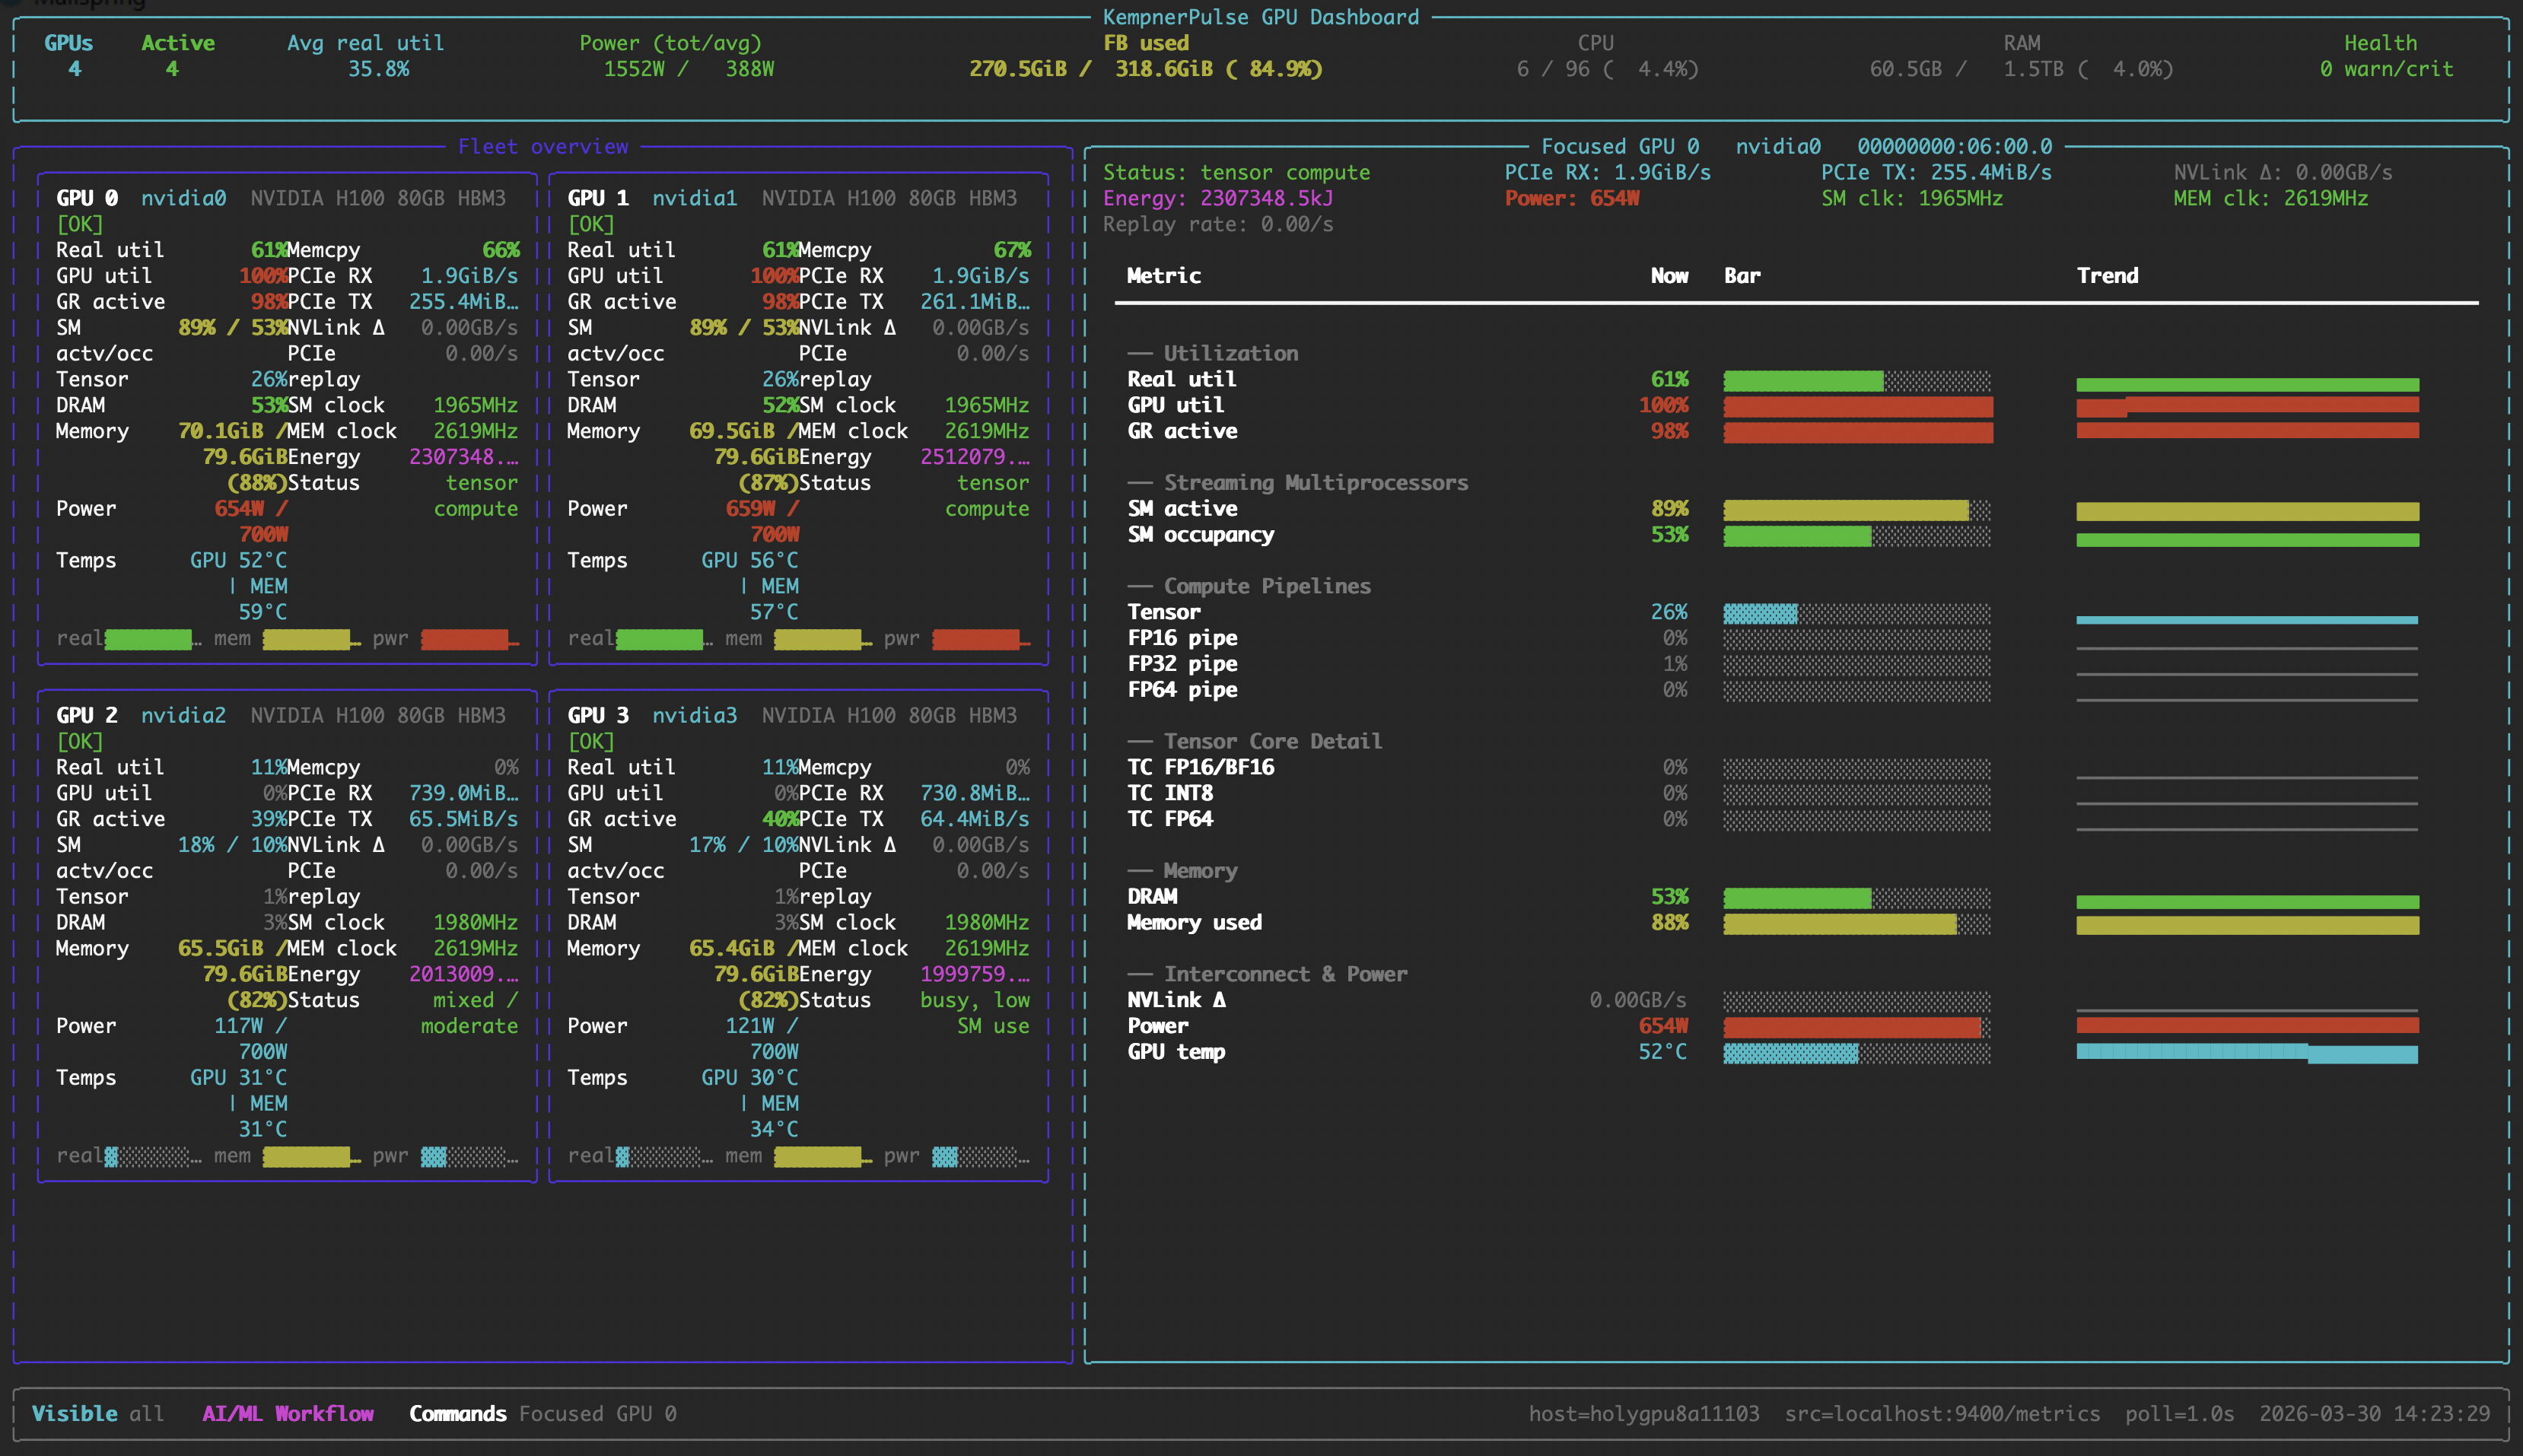
### Focus View
Deep dive into a single GPU with per-metric sparkline history.
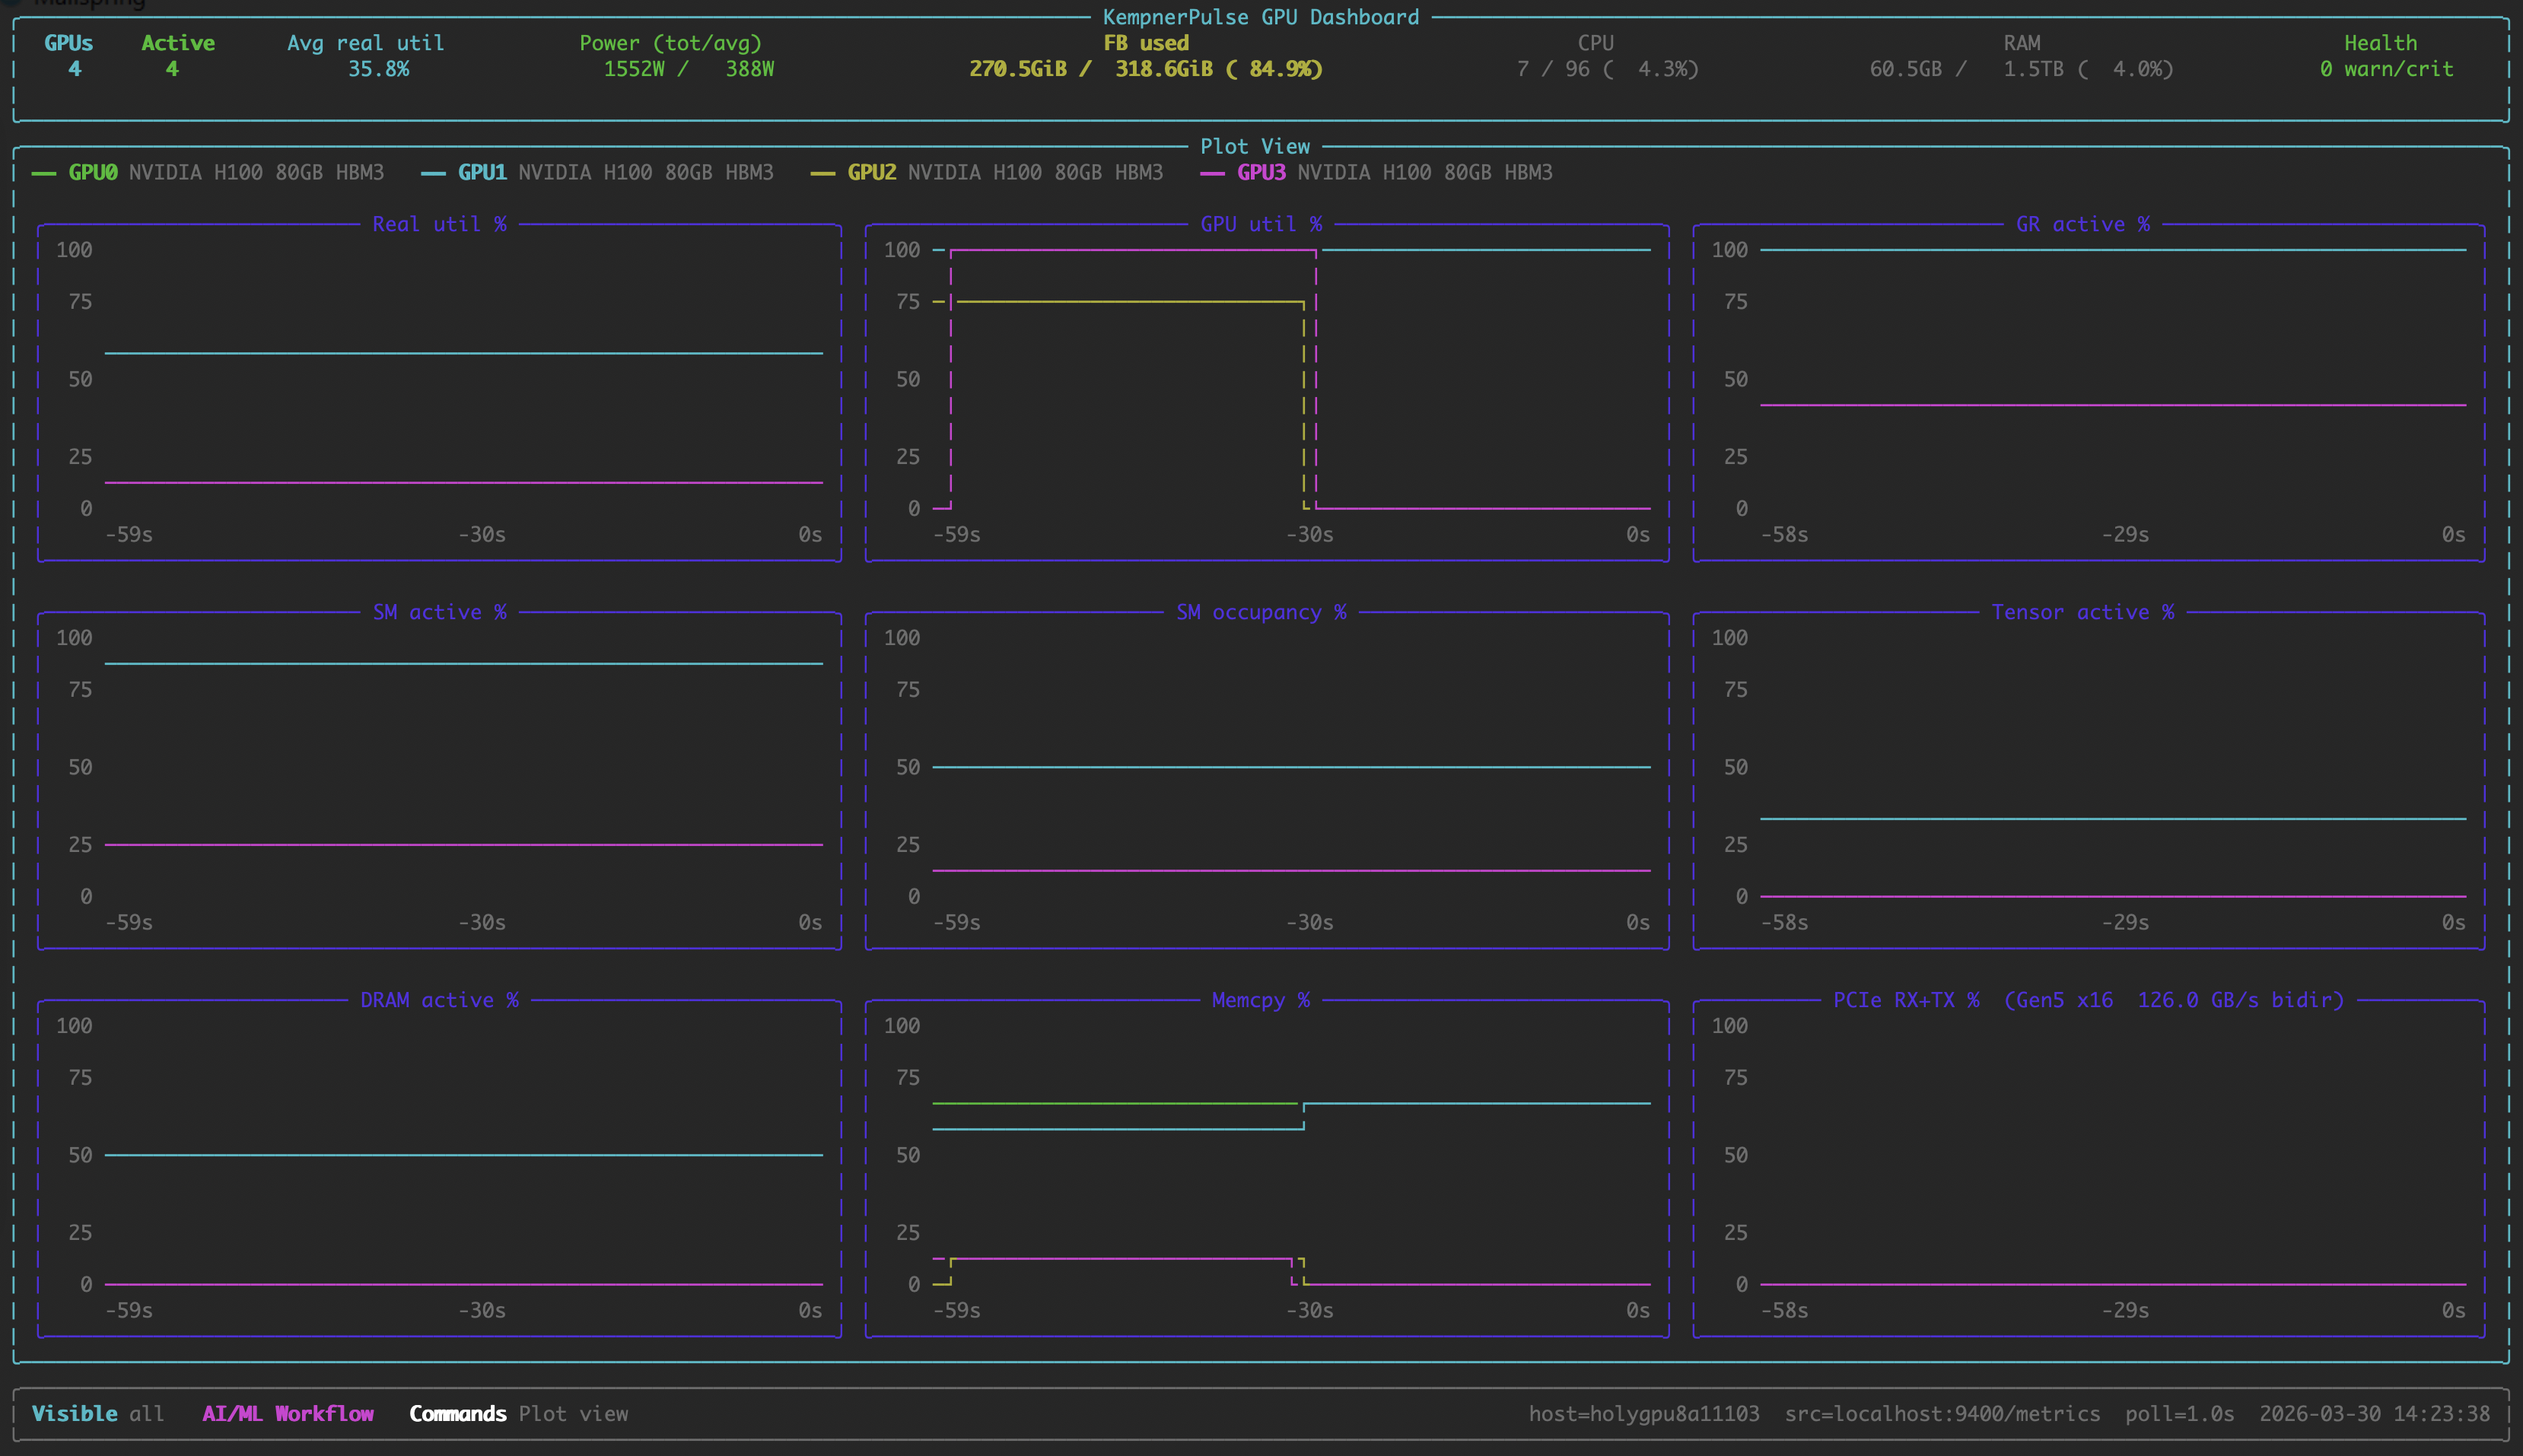
### Plot View
Stacked line charts across all GPUs.
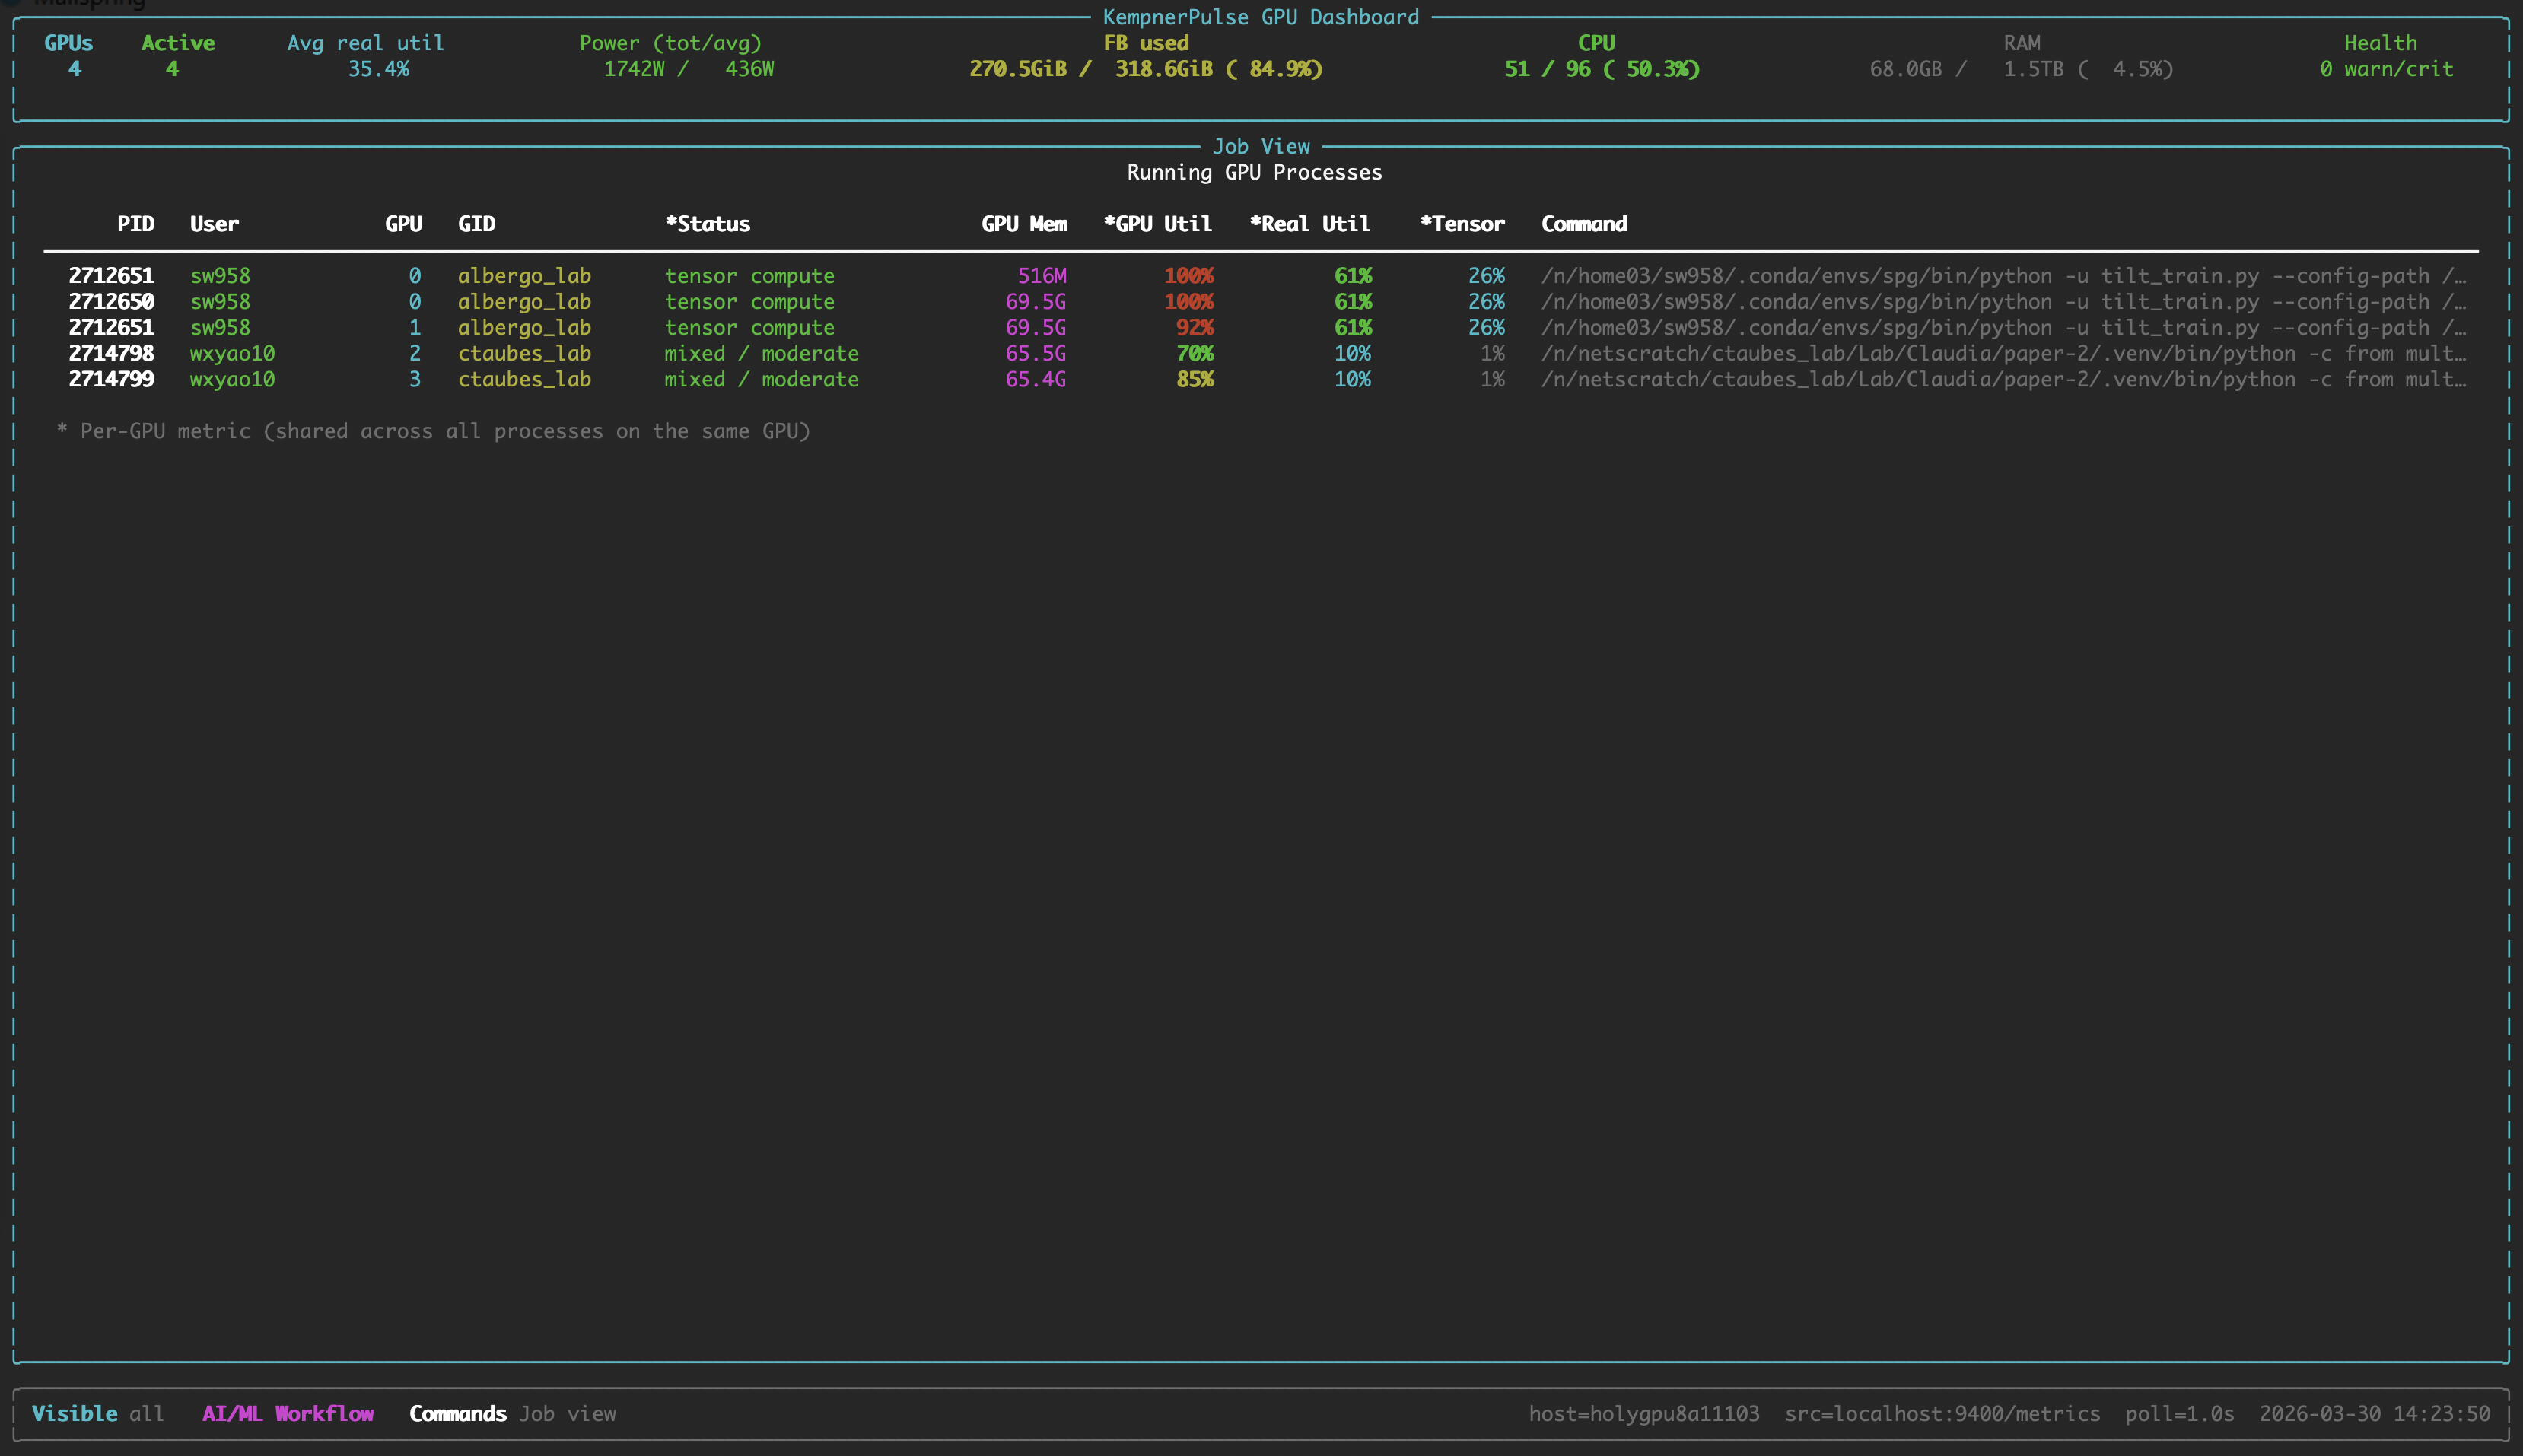
### Job View
Running GPU compute processes with per-GPU metrics.
## Requirements
- Linux with NVIDIA GPUs
- [dcgm-exporter](https://github.com/NVIDIA/dcgm-exporter) running and
exposing `/metrics` (default: `http://localhost:9400/metrics`) — or
`dcgmi` CLI available for `--backend dcgm`
- Python >= 3.9
- `nvidia-smi` on the PATH (for hardware queries and process listing)
> **Note:** KempnerPulse currently supports NVIDIA datacenter GPUs (V100, A100, H100, H200, B200, B300).
> Grace-Hopper (GH200), Grace-Blackwell (GB200) and RTX support is planned but not yet tested.
> AMD GPUs are not supported.
## Installation
```bash
pip install kempnerpulse
```
Or install from source:
```bash
pip install .
```
## Quick Start
```bash
# Default: connect to localhost:9400/metrics, show SLURM/CUDA-visible GPUs
kempnerpulse
# Explicit source and GPU selection
kempnerpulse --source http://gpu-node:9400/metrics --gpus 0,1,2,3
# Show all GPUs on the node
kempnerpulse --show-all
# Start in focus view for GPU 0
kempnerpulse --focus-gpu 0
# Use direct DCGM backend (bypasses Prometheus, higher resolution)
kempnerpulse --backend dcgm
# Use HPC weight preset
kempnerpulse --hpc-weights
# Custom weights (SM, Tensor, DRAM, GR; normalized automatically)
kempnerpulse --weights 0.40,0.30,0.20,0.10
# Export CSV (default columns) — only GPUs with your processes
kempnerpulse --export > metrics.csv
# Export all columns
kempnerpulse --export all > metrics.csv
# Export custom columns
kempnerpulse --export gpu_id,real_util_pct,power_w,tensor_active_pct > metrics.csv
# Single snapshot export
kempnerpulse --export --once
```
## Interactive Commands
| Command | Action |
|---------------|---------------------------------------------|
| `:focus ` | Enter focused view for a specific GPU |
| `:plot` | Enter plot view (line charts) |
| `:job` | Enter job view (running GPU processes) |
| `:q` | Return to fleet view (or exit if in fleet) |
| `:exit` | Exit the dashboard |
| `Ctrl+C` | Exit the dashboard |
| `Esc` | Cancel an unfinished `:` command |
## CLI Reference
| Flag | Type | Default | Description |
|------|------|---------|-------------|
| `--version` | | | Show version and exit. |
| `--backend` | string | `prometheus` | Data source backend: `prometheus` (dcgm-exporter HTTP) or `dcgm` (dcgmi dmon direct). |
| `--source URL` | string | `http://localhost:9400/metrics` | dcgm-exporter `/metrics` endpoint or a local text file (prometheus backend only). |
| `--poll SECS` | float | `1.0` | Sampling/refresh interval in seconds. With `--backend dcgm`, drives a persistent `dcgmi` stream and is honored down to a 100ms floor (DCGM profiling counters refresh at ~10Hz internally; below 100ms most profiling rows would be blank). With `--backend prometheus`, must be `>= 1.0` (dcgm-exporter scrapes profiling fields at ~30s, so sub-second values just duplicate samples). |
| `--history N` | int | `120` | Number of samples kept for sparkline history. |
| `--focus-gpu ID` | string | | Start in Focus View for the given GPU id (e.g. `0`). |
| `--once` | flag | | Render a single snapshot and exit instead of running live. |
| `--gpus IDS` | string | | Explicit GPU ids or ranges (`0,1` or `0-3`). Overrides SLURM/CUDA env vars. |
| `--show-all` | flag | | Ignore SLURM/CUDA visibility env vars; show every GPU in the source. |
| `--weights W` | 4 floats | `0.35,0.35,0.20,0.10` | Comma-separated Real Util weights: SM,TENSOR,DRAM,GR. Auto-normalized. |
| `--ai-weights` | preset | | AI/LLM training preset `(0.35, 0.35, 0.20, 0.10)`. This is the default. |
| `--hpc-weights` | preset | | HPC / mixed CUDA preset `(0.45, 0.15, 0.25, 0.15)`. |
| `--mem-weights` | preset | | Memory-bound / bandwidth-heavy preset `(0.35, 0.10, 0.40, 0.15)`. |
| `--export` | string | *(off)* | Output CSV to stdout. `--export` for default columns, `--export all` for every column, or `--export col1,col2,...` for a custom set. Rows are emitted for every GPU in the visibility set (`CUDA_VISIBLE_DEVICES` / `SLURM_JOB_GPUS` / `--gpus`), so you can start the recorder before your job launches. |
### GPU Visibility Selection
The dashboard picks the first available source in this order:
1. `--gpus` flag
2. `CUDA_VISIBLE_DEVICES` env var
3. `NVIDIA_VISIBLE_DEVICES` env var
4. `SLURM_STEP_GPUS` env var
5. `SLURM_JOB_GPUS` env var
If none are set, all GPUs on the node are shown. Use `--show-all` to
explicitly override all env vars. All GPU selections are filtered against
GPUs accessible to the current process (as reported by `nvidia-smi`),
which respects cgroup and container restrictions.
## Weight Presets
| Preset | Flag | SM | Tensor | DRAM | GR | Best For |
|-----------------|------------------|-------|--------|-------|-------|----------|
| AI/ML (default) | `--ai-weights` | 0.35 | 0.35 | 0.20 | 0.10 | DL training, LLM inference, transformers |
| HPC | `--hpc-weights` | 0.45 | 0.15 | 0.25 | 0.15 | Scientific computing, mixed CUDA |
| Memory-bound | `--mem-weights` | 0.35 | 0.10 | 0.40 | 0.15 | Bandwidth-heavy workloads, stencil codes |
Custom: `--weights 0.40,0.30,0.20,0.10` (values are normalized automatically).
## How It Works
KempnerPulse reads GPU metrics via one of two backends: **Prometheus**
(dcgm-exporter HTTP endpoint, ~30 s update interval for profiling fields) or
**DCGM direct** (`dcgmi dmon`, configurable down to ~100 ms).
It computes a **Real Utilization** score as a weighted combination of four
DCGM profiling counters:
```
Real Util = clamp(0, 100,
W_sm × SM_ACTIVE
+ W_tensor × TENSOR_ACTIVE
+ W_dram × DRAM_ACTIVE
+ W_gr × GR_ENGINE_ACTIVE)
```
This gives a more accurate picture of GPU utilization than `nvidia-smi`'s
`GPU-Util` alone, which only reports kernel-launch duty cycle.
## Workload Classification
Each GPU is classified into one of **12 categories** every refresh cycle,
based on thresholds from
[NVIDIA's DCGM profiling metric guidance](https://docs.nvidia.com/datacenter/dcgm/latest/user-guide/feature-overview.html#profiling).
Categories are evaluated in order and the first matching rule wins.
| Status | Thresholds | Rationale |
|--------|------------|-----------|
| **idle** | Real Util < 5 %, GR < 5 %, DRAM < 5 %, no I/O | Nothing running. |
| **tensor-heavy compute** | Tensor ≥ 50 % and SM ≥ 60 % | DL training / large-scale inference. |
| **tensor compute** | Tensor ≥ 15 % and SM ≥ 40 % | Mixed-precision, moderate tensor use. |
| **FP64 / HPC compute** | FP64 ≥ 20 % and SM ≥ 50 % | Scientific double-precision workload. |
| **I/O or data-loading** | Memcpy ≥ 40 % or PCIe ≥ 1 GB/s, SM < 30 % | Heavy transfer; SMs idle. |
| **memory-bound** | DRAM ≥ 50 % and SM < 50 % | Bandwidth limited. |
| **compute-heavy** | SM ≥ 80 % | Effective SM use (NVIDIA: ≥ 80 % needed). |
| **compute-active** | SM ≥ 50 % | Moderate compute, no tensor dominance. |
| **memory-active** | DRAM ≥ 40 % | Significant DRAM traffic. |
| **busy, low SM use** | GR ≥ 40 % and SM < 25 % | Overhead / sync / small kernels. |
| **low utilization** | GR < 15 %, SM < 15 %, DRAM < 15 % | Barely active. |
| **mixed / moderate** | *(fallthrough)* | No single dominant pattern. |
Full details, bottleneck color key, and NVIDIA reference points:
[docs/classification.md](docs/classification.md)
## Health Monitoring
| Status | Condition | Meaning |
|--------|-----------|---------|
| **OK** | *(none of the below)* | Normal operation. |
| **WARN** | PCIe replay rate > 0/s | PCIe link retransmissions occurring. |
| **HOT** | GPU or memory temp ≥ warning threshold | Approaching thermal throttling. |
| **CRIT** | Row-remap failure > 0 or uncorrectable remapped rows > 0 | Hardware memory errors. Remove from production. |
Temperature warning thresholds are per-model (A100: 93 °C, H100/H200: 95 °C,
RTX 6000: 92 °C, default: 93 °C). Full threshold table:
[docs/classification.md](docs/classification.md#temperature-thresholds-by-gpu-model)
## CSV Export
Export GPU metrics as CSV for offline analysis or terminal monitoring. Only GPUs
where the current user has running compute processes are included.
```bash
kempnerpulse --export > metrics.csv # default columns
kempnerpulse --export all > metrics.csv # all 34 columns
kempnerpulse --export gpu_id,real_util_pct,power_w > metrics.csv # custom
kempnerpulse --export --once # single snapshot
```
Default columns: `timestamp, gpu_id, model, gpu_util_pct, mem_used_mib,
real_util_pct, sm_active_pct, tensor_active_pct, dram_active_pct`
Full column reference and usage details:
[docs/export.md](docs/export.md)
## DCGM Metrics
KempnerPulse consumes ~30 DCGM fields covering profiling counters, memory,
temperature, power, clocks, PCIe, NVLink, and error counters. The complete
list with descriptions and NVIDIA doc links:
[docs/metrics.md](docs/metrics.md)
## Performance Overhead
KempnerPulse introduces minimal runtime overhead, using approximately 8.2% of a single CPU core on an AMD EPYC 9374F processor, with negligible memory usage (below the reporting resolution of `top`).
## License
MIT. See [LICENSE](LICENSE) for details.