https://github.com/kis/scale
Angular plugin for creating charts
https://github.com/kis/scale
angular-plugin barchart chart kinopoisk timeline timesheet
Last synced: about 1 year ago
JSON representation
Angular plugin for creating charts
- Host: GitHub
- URL: https://github.com/kis/scale
- Owner: kis
- License: mit
- Created: 2016-06-08T14:34:40.000Z (about 10 years ago)
- Default Branch: master
- Last Pushed: 2022-10-25T08:46:30.000Z (over 3 years ago)
- Last Synced: 2024-09-28T09:02:48.687Z (over 1 year ago)
- Topics: angular-plugin, barchart, chart, kinopoisk, timeline, timesheet
- Language: JavaScript
- Homepage: https://chartify.github.io/scale/example/
- Size: 11.4 MB
- Stars: 41
- Watchers: 6
- Forks: 2
- Open Issues: 0
-
Metadata Files:
- Readme: README.md
- Contributing: CONTRIBUTING.md
- License: LICENSE
- Code of conduct: CODE_OF_CONDUCT.md
Awesome Lists containing this project
README
# Scale
[](https://www.npmjs.com/package/angular-scale)
[](https://www.npmjs.com/package/angular-scale)
[](https://www.npmjs.com/package/angular-scale)

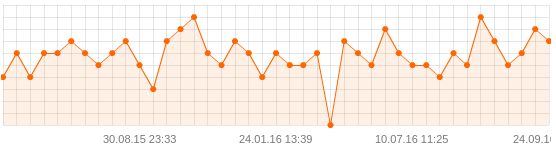
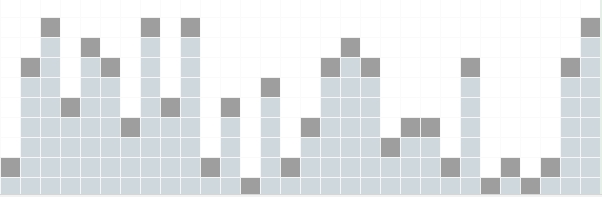
Angular plugin for building scale of items. Chart ruler completely on HTML/CSS/JS. Bar chart, line chart, calendar view visualisation. Diagram, graph, pyramid visualisation of large datasets. Showreel. The source for this module is in the [main repo](https://github.com/kirillstepkin/scale). Please create issues and pull requests.
Inspired by [kinopoisk.ru](https://www.kinopoisk.ru/) chart written using Adobe Flash. But this chart is just on HTML/CSS without using libraries. Feel free for contribute.
### Install
```
bower install angular-scale
npm install angular-scale
```
### Use
```html
```
```javascript
angular.module('myApp', ['scale']).controller('main', ['$scope', function($scope) {
$scope.data = [];
var SCALE_WIDTH = 50,
SCALE_HEIGHT = 10;
for (var i=0; i < SCALE_WIDTH; i++) {
var value = Math.floor(Math.random() * SCALE_HEIGHT + 1);
$scope.data.push({
value: value, //Value from 1 to SCALE_HEIGHT
title: (i + 1) + " item" //Description
});
}
}]);
```
### Options
```html
```
* **data** is an array of objects [{value: 0}, ... , {value: 10}]. This is the dataset of the chart.
* **width** is the horizontal length of the data array. If width param is less than the length of the data array then user will see the last values of the data array.
* **height** is the vertical length.
* **box-size** is size of each box in pixels.
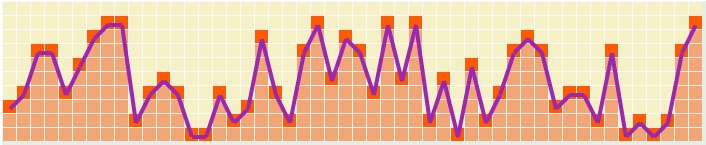
* **line** is param that determines if this is a line-chart.
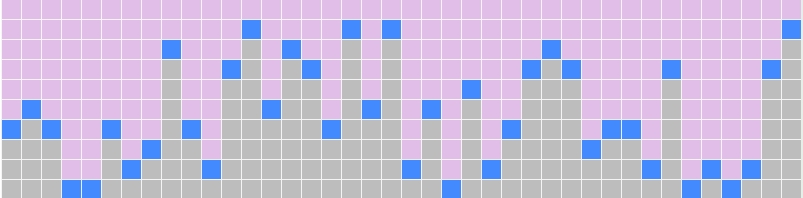
* **theme** is color scheme of the chart.
Please check the example folder to see how it's going on practice.
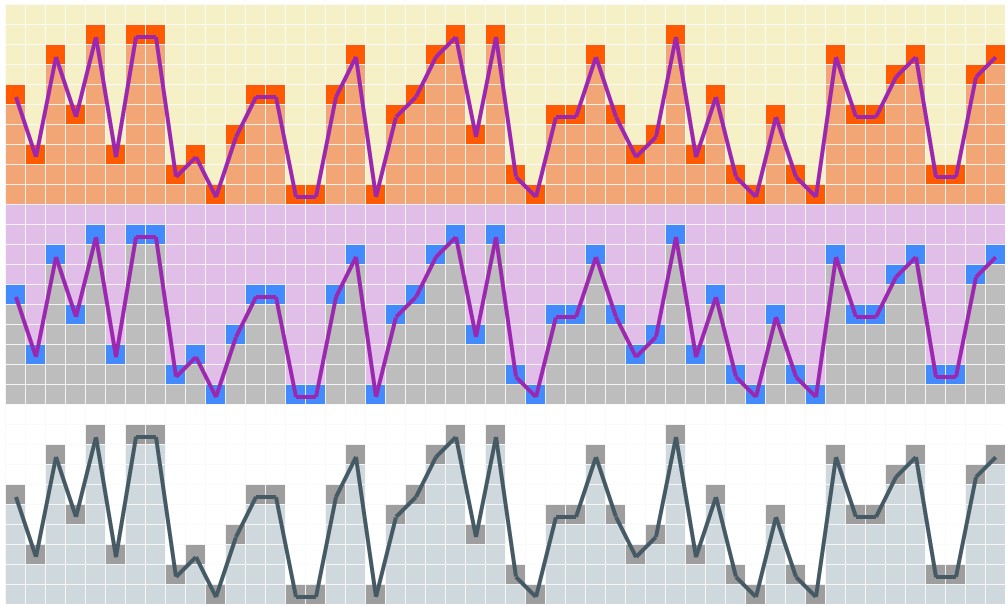
### Themes
* default
* purple
* grey
### Changelog
* 10/02/2016 Implemented tooltips.
* 10/01/2016 Implemented different color schemes.
* 09/20/2016 Rewriting the project as an Angular.js plugin.
* 06/05/2016 Finished writing function for calculating angle of the line that connects the points of the chart. Rendering chart.
### License
Copyright (c) 2016 [Kirill Stepkin](https://www.npmjs.com/~kirillstyopkin)
Inspired by [kinopoisk.ru](https://www.kinopoisk.ru/) chart.
[](https://github.com/kirillstepkin/scale)