Ecosyste.ms: Awesome
An open API service indexing awesome lists of open source software.
https://github.com/kivy-garden/garden.touchgraph
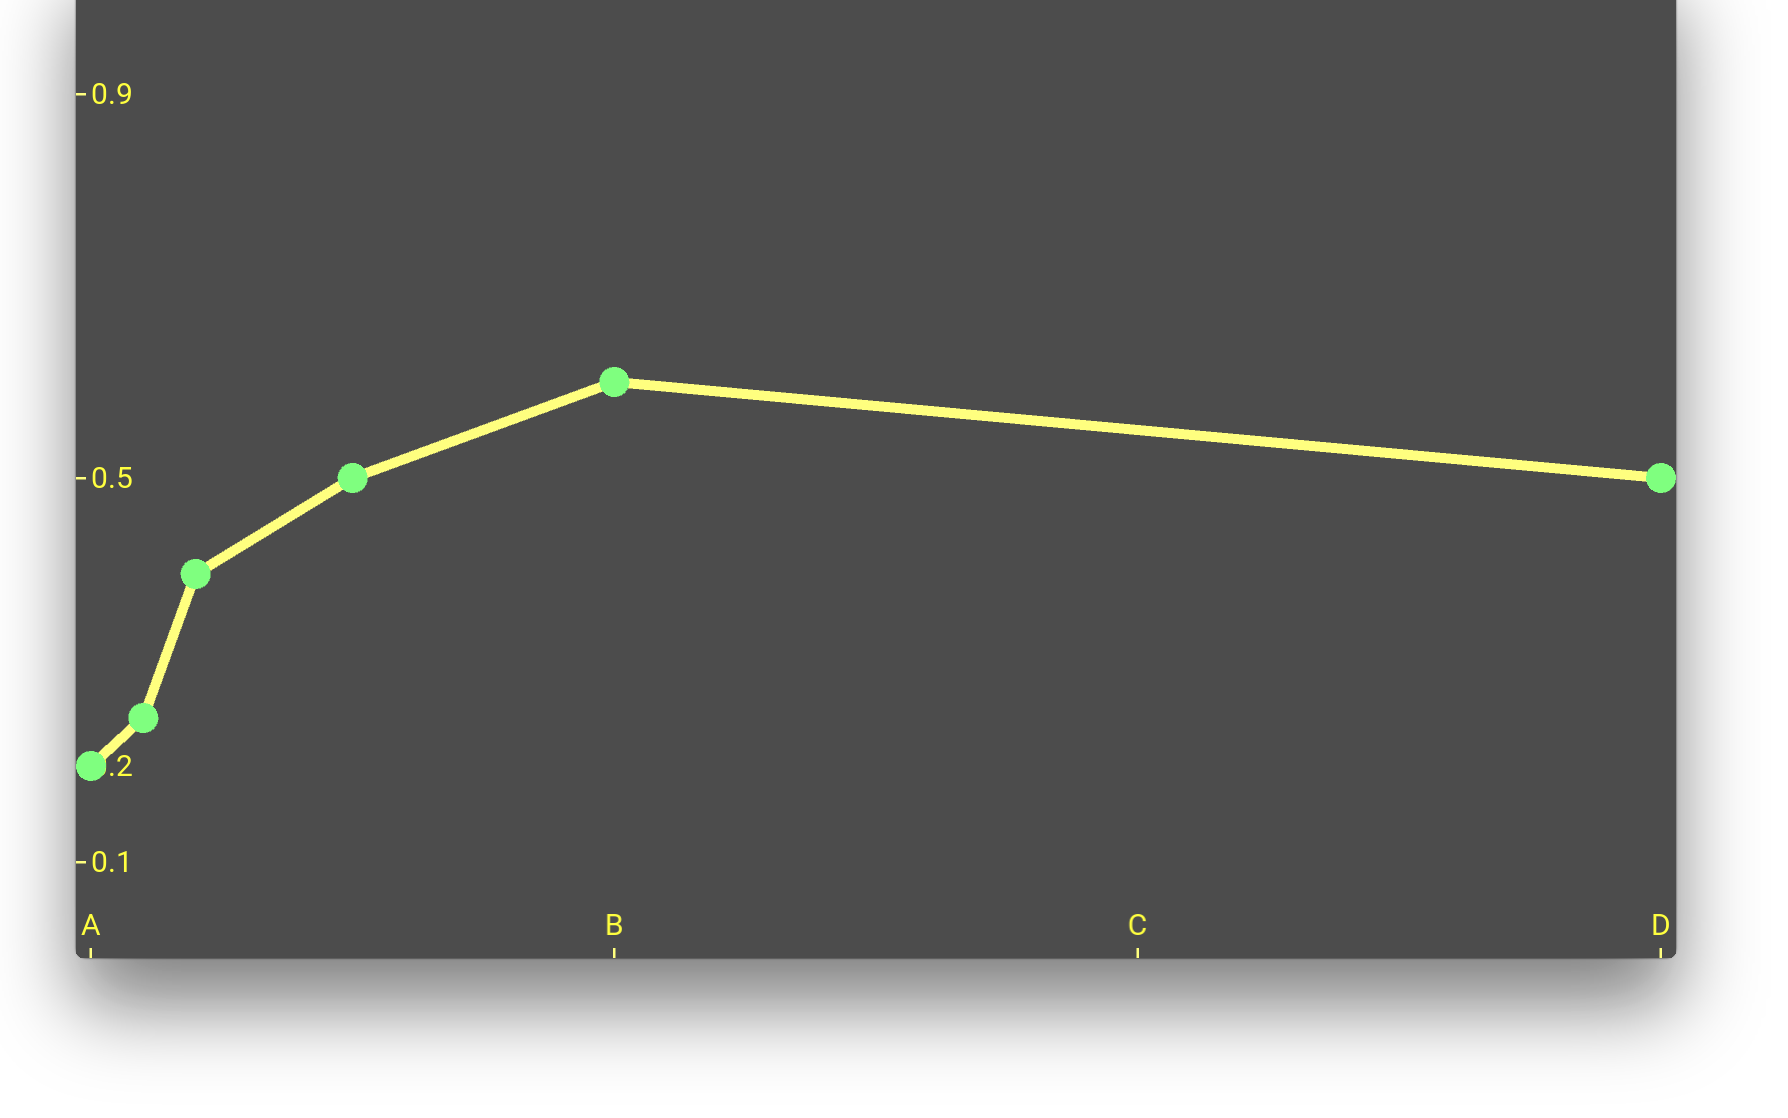
A widget for Kivy that allows the user to define a 2D-function
https://github.com/kivy-garden/garden.touchgraph
Last synced: about 1 month ago
JSON representation
A widget for Kivy that allows the user to define a 2D-function
- Host: GitHub
- URL: https://github.com/kivy-garden/garden.touchgraph
- Owner: kivy-garden
- License: mit
- Created: 2016-10-27T11:28:08.000Z (about 8 years ago)
- Default Branch: master
- Last Pushed: 2017-01-09T15:28:23.000Z (almost 8 years ago)
- Last Synced: 2024-04-24T04:55:07.365Z (8 months ago)
- Language: Python
- Size: 58.6 KB
- Stars: 9
- Watchers: 4
- Forks: 1
- Open Issues: 0
-
Metadata Files:
- Readme: README.md
- License: LICENSE
Awesome Lists containing this project
README

# Touchgraph
TouchGraph is a Kivy widget for displaying a 2D graph based composed of
a number of interconnectedstraight lines. The user can adjust the form
of the graph in order to define a function. Is is based on the ```bezier.py```
example from the Kivy examples.
A use case for this widget is the situation where a functional relationship
between two variables (e.g. a sensor reading like temperature and a desired
reaction like fan speed) needs to be defined by the user.
# Features
* user-defined tickmarks and labels
* static function provided for using the defined graph (```y_for_x()```)
* input validation for points provided
# Install
Install the touchgraph garden module using the `garden` tool:
```
garden install touchgraph
```
# Usage
The following parameters are available:
## points
Pass a list of points as ```[x1, y1, x2, y2, ...]``` to define the default
function. Points do not have to start at (0,0) although it makes sense to
start x with 0. x values must be in ascending order.
## x_ticks, y_ticks (optional)
Defines where tickmarks should be placed. If x_labels or y_labels is not
defined, the ticks are labeled with the value of x or y.
## x_labels, y_labels (optional)
Text labels for the tickmarks.
## max_y
Maximum value for the y-axis, if the default function does not reach the maximum value
## line_width (optional)
Line width of the displayed graph
## font_size (optional)
Font size for the labels
## pointColor, lineColor, backColor (optional)
Color values for the different parks of the graph