https://github.com/kohkimakimoto/echo-debugmonitor
A debugging and monitoring dashboard for Go applications using the Echo web framework.
https://github.com/kohkimakimoto/echo-debugmonitor
go golang labstack-echo
Last synced: 5 months ago
JSON representation
A debugging and monitoring dashboard for Go applications using the Echo web framework.
- Host: GitHub
- URL: https://github.com/kohkimakimoto/echo-debugmonitor
- Owner: kohkimakimoto
- License: mit
- Created: 2023-08-26T23:53:31.000Z (almost 3 years ago)
- Default Branch: main
- Last Pushed: 2025-11-17T09:54:32.000Z (7 months ago)
- Last Synced: 2025-11-17T11:24:03.390Z (7 months ago)
- Topics: go, golang, labstack-echo
- Language: HTML
- Homepage:
- Size: 386 KB
- Stars: 1
- Watchers: 1
- Forks: 0
- Open Issues: 0
-
Metadata Files:
- Readme: README.md
- License: LICENSE
Awesome Lists containing this project
README
# Echo Debug Monitor
[](https://github.com/kohkimakimoto/echo-debugmonitor/actions/workflows/test.yml)
[](https://github.com/kohkimakimoto/echo-debugmonitor/blob/master/LICENSE)
[](https://pkg.go.dev/github.com/kohkimakimoto/echo-debugmonitor)
**This repository is still under active development. Documentation is incomplete and breaking changes may occur.**
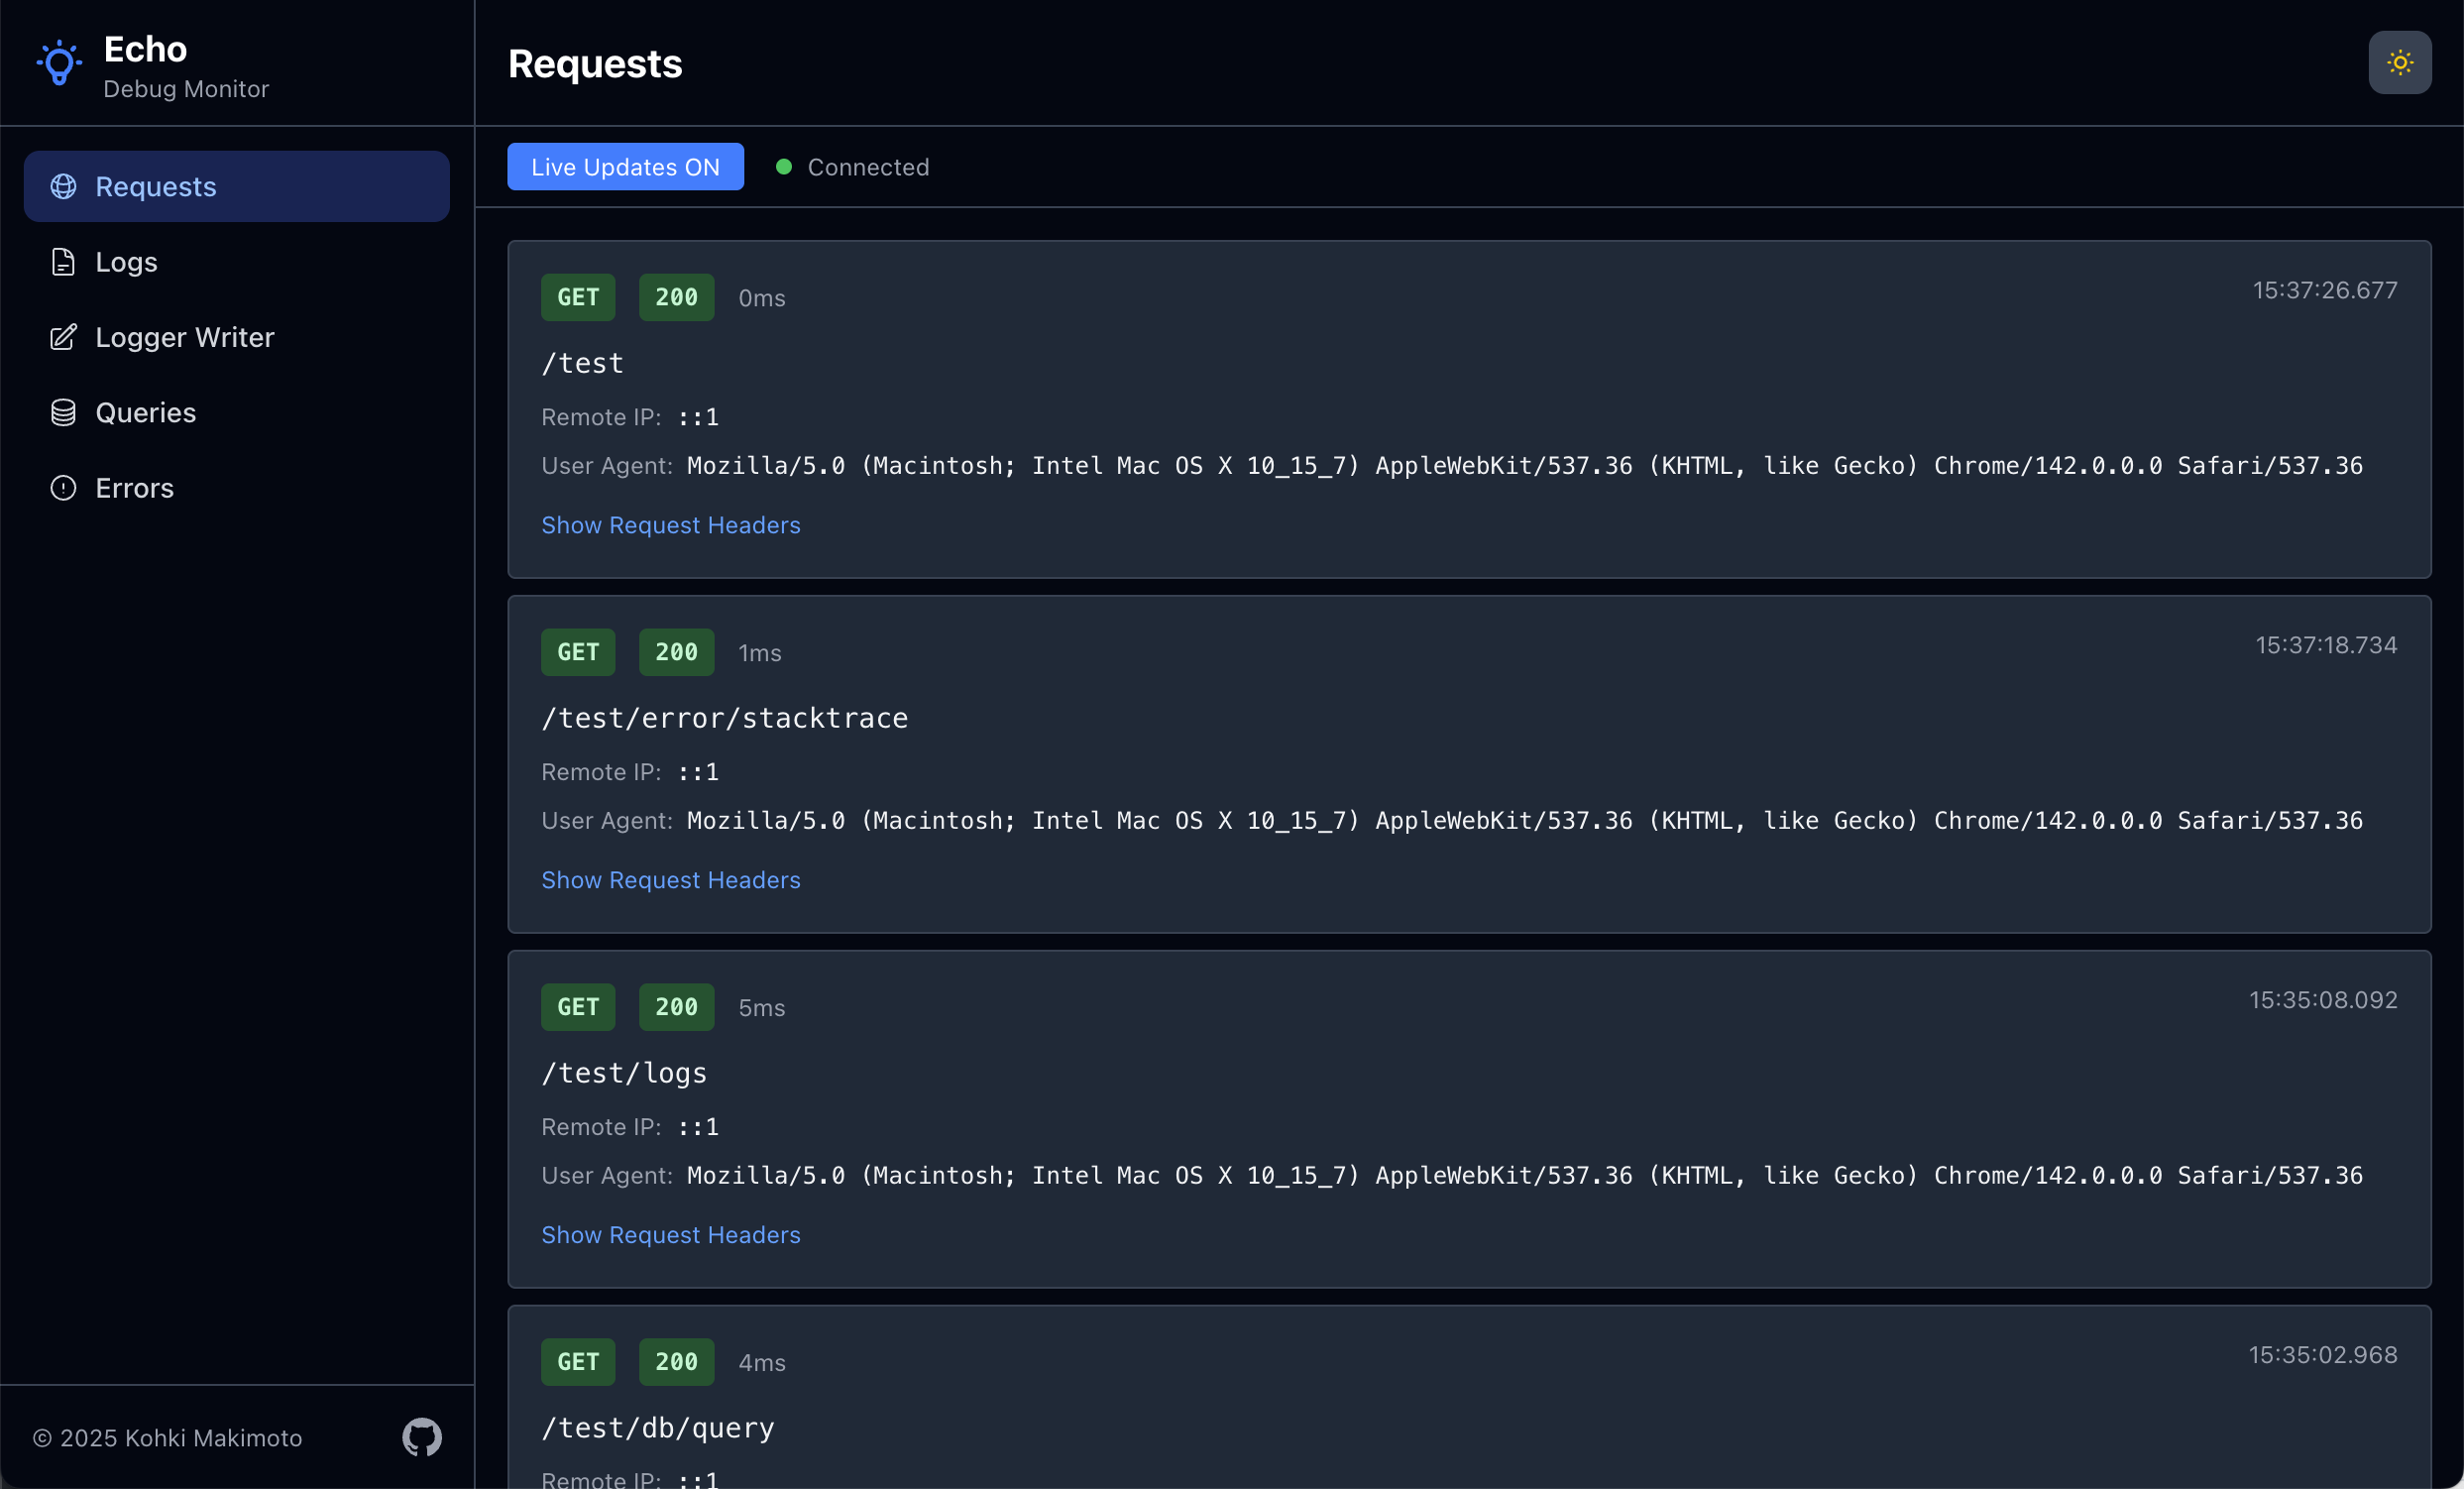
A debugging and monitoring dashboard for Go applications using the [Echo](https://echo.labstack.com/) web framework.
Provides real-time visibility into application behavior through multiple specialized monitors.
> [!WARNING]
> This tool is intended for debugging and development purposes only. **Do not activate it in production environments** as it may expose sensitive information and impact performance.
## Getting Started
### Installation
```bash
go get github.com/kohkimakimoto/echo-debugmonitor
```
### Basic Usage
Here's a simple example to get started with Echo Debug Monitor:
```go
package main
import (
"github.com/labstack/echo/v4"
debugmonitor "github.com/kohkimakimoto/echo-debugmonitor"
"github.com/kohkimakimoto/echo-debugmonitor/monitors"
)
func main() {
e := echo.New()
// Create the debug monitor manager
m := debugmonitor.New()
// Add requests monitor
requestsMonitor, requestsMonitorMiddleware := monitors.NewRequestsMonitor(&monitors.RequestsMonitorConfig{
Skipper: func(c echo.Context) bool {
return c.Path() == "/monitor" // Skip monitoring the monitor endpoint itself
},
})
e.Use(requestsMonitorMiddleware)
m.AddMonitor(requestsMonitor)
// Add logs monitor
logsMonitor, wrappedLogger := monitors.NewLogsMonitor(monitors.LogsMonitorConfig{
Logger: e.Logger,
})
e.Logger = wrappedLogger
m.AddMonitor(logsMonitor)
// Register the dashboard route
e.GET("/monitor", m.Handler())
// Your application routes
e.GET("/", func(c echo.Context) error {
e.Logger.Info("Home page accessed")
return c.String(200, "Hello, World!")
})
e.Start(":8080")
}
```
Then access the monitoring dashboard at `http://localhost:8080/monitor`.
## Monitors
Monitors are the core units in Echo Debug Monitor. Each monitor tracks a specific aspect of your application and displays it in the dashboard.
A monitor is an independent component that:
- Captures specific types of data (requests, logs, errors, etc.)
- Stores captured data in an in-memory buffer.
- Provides a real-time view in the web interface
Each monitor operates independently and can be added or removed.
You can also implement custom monitors for your specific needs.
## Built-in Monitors
Echo Debug Monitor includes several ready-to-use monitors in the `github.com/kohkimakimoto/echo-debugmonitor/monitors` package:
- **Requests Monitor**: Tracks incoming HTTP requests, response statuses, latencies, etc.
- **Logs Monitor**: Captures application logs and displays them in real-time.
- **Writer Monitor**: Monitors output written to `io.Writer` interfaces.
- **Errors Monitor**: Records application errors and stack traces.
- **Queries Monitor**: Tracks database queries.
## Implementing Custom Monitors
WIP
## License
The MIT License (MIT)
## Author
Kohki Makimoto