Ecosyste.ms: Awesome
An open API service indexing awesome lists of open source software.
https://github.com/kreshikhin/clumsy
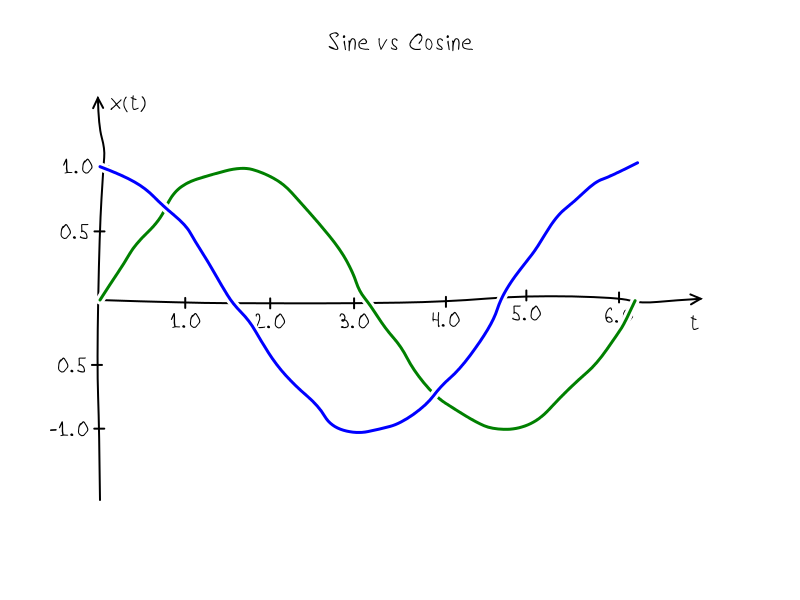
A library written on node.js for creating math figures on HTMLCanvas in XKCD style.
https://github.com/kreshikhin/clumsy
animation axis canvas drawing
Last synced: about 2 months ago
JSON representation
A library written on node.js for creating math figures on HTMLCanvas in XKCD style.
- Host: GitHub
- URL: https://github.com/kreshikhin/clumsy
- Owner: kreshikhin
- License: mit
- Created: 2015-09-10T12:14:57.000Z (over 9 years ago)
- Default Branch: master
- Last Pushed: 2016-08-29T20:23:12.000Z (over 8 years ago)
- Last Synced: 2024-10-31T19:49:33.494Z (about 2 months ago)
- Topics: animation, axis, canvas, drawing
- Language: JavaScript
- Homepage:
- Size: 741 KB
- Stars: 112
- Watchers: 9
- Forks: 9
- Open Issues: 1
-
Metadata Files:
- Readme: README.md
- License: LICENSE
Awesome Lists containing this project
README
# Clumsy
[![NPM Version][npm-image]][npm-url]
[![NPM Downloads][downloads-image]][downloads-url]
[![Build Status][travis-image]][travis-url]
Clumsy.js is a library for creating math figures on HTMLCanvas in XKCD style.
This library can be used with Node.js libraries `canvas` and `gifencoder`:
```shell
$ npm install canvas gifencoder
```

## Contents
* [Preparing for drawing](#preparing)
* [Drawing a figure](#drawing)
* [Drawing a figure with scaled axis and title](#axis-and-title)
* [Animation](#animation)
* [API](#api)
* [new Clumsy(canvas)](#newclumsy)
* methods:
* [axis](#axis)
* [background](#background)
* [clean](#clean)
* [draw](#draw)
* [fillTextAtCenter](#filltext)
* [overdraw](#overdraw)
* [padding](#padding)
* [seed](#seed)
* [range](#range)
* [tabulate](#tabulate)
* properties:
* [background](#properties)
* [color](#properties)
* [defaultBoxAscent](#properties)
* [lineWidth](#properties)
* [radius](#properties)
* [step](#properties)
* [License](#license)
It needs to create Canvas before drawing and pass this canvas to constructor of object Clumsy. By default clumsy object have padding in 100px and ranges [-1, 1] in both directions. This can be changed by special methods:
```js
// Adds canvas module from npm repository for example
var Canvas = require('canvas');
// Adds this module
var clumsy = require('clumsy');
// And some helpers for interaction with canvas and gifencoder modules
var helpers = require('clumsy/helpers');
// Inits objects
var canvas = new Canvas(800, 600)
var clumsy = new Clumsy(canvas);
// Sets padding and ranges before drawing
clumsy.padding(50);
clumsy.range(0, 2*Math.PI, -1.5, 1.5);
```
Pass arrays with points to method draw. Each point must consider x and y field, e.g. {x: 0, y: 0} - begin coordinate system.
```js
var Canvas = require('canvas');
var clumsy = require('clumsy');
var helpers = require('clumsy/helpers');
var canvas = new Canvas(800, 600)
var clumsy = new Clumsy(canvas);
clumsy.padding(50);
clumsy.range(0, 2*Math.PI, -1.5, 1.5);
clumsy.color('red');
clumsy.lineWidth(2);
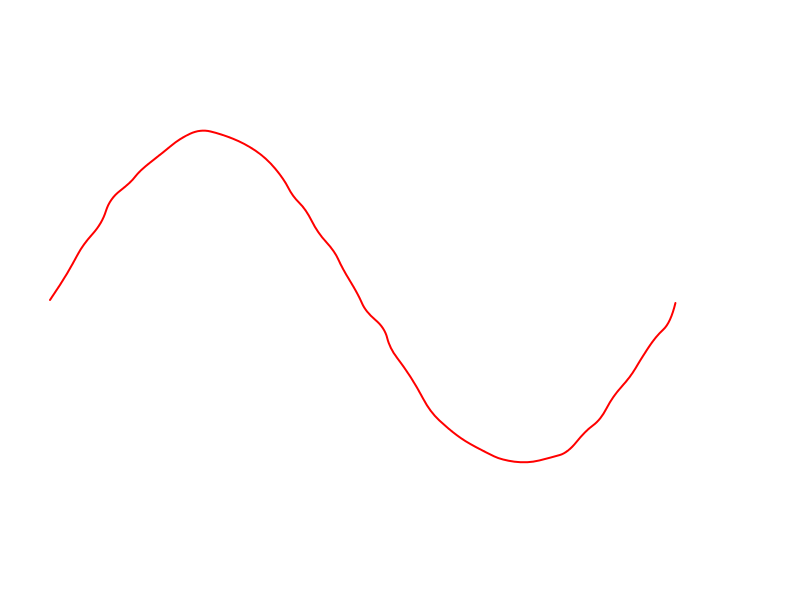
var sine = clumsy.tabulate(0, 2*Math.PI, 0.01, Math.sin);
clumsy.draw(sine);
helpers.saveAsPng(clumsy); // save as png of same name
```
The result:

## Drawing a figure with scaled axis and title
```javascript
var Canvas = require('canvas');
var Clumsy = require('clumsy');
var helpers = require('clumsy/helpers');
var canvas = new Canvas(800, 600)
var clumsy = new Clumsy(canvas);
clumsy.font('24px VoronovFont');
clumsy.padding(50);
clumsy.range(0, 7, -2, 2);
clumsy.lineWidth(2);
clumsy.axis('x', 0, 7, 0.5);
clumsy.axis('y', -2, 2, 0.5);
clumsy.color('red');
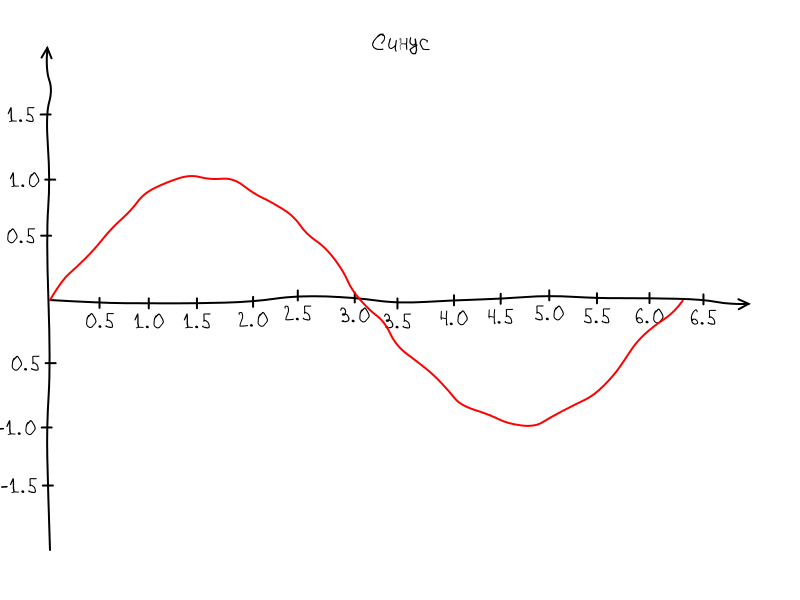
var sine = clumsy.tabulate(0, 2*Math.PI, 0.01, Math.sin);
clumsy.draw(sine);
clumsy.fillTextAtCenter('Синус', clumsy.canvas.width/2, 50);
helpers.saveAsPng(clumsy);
```
The result:

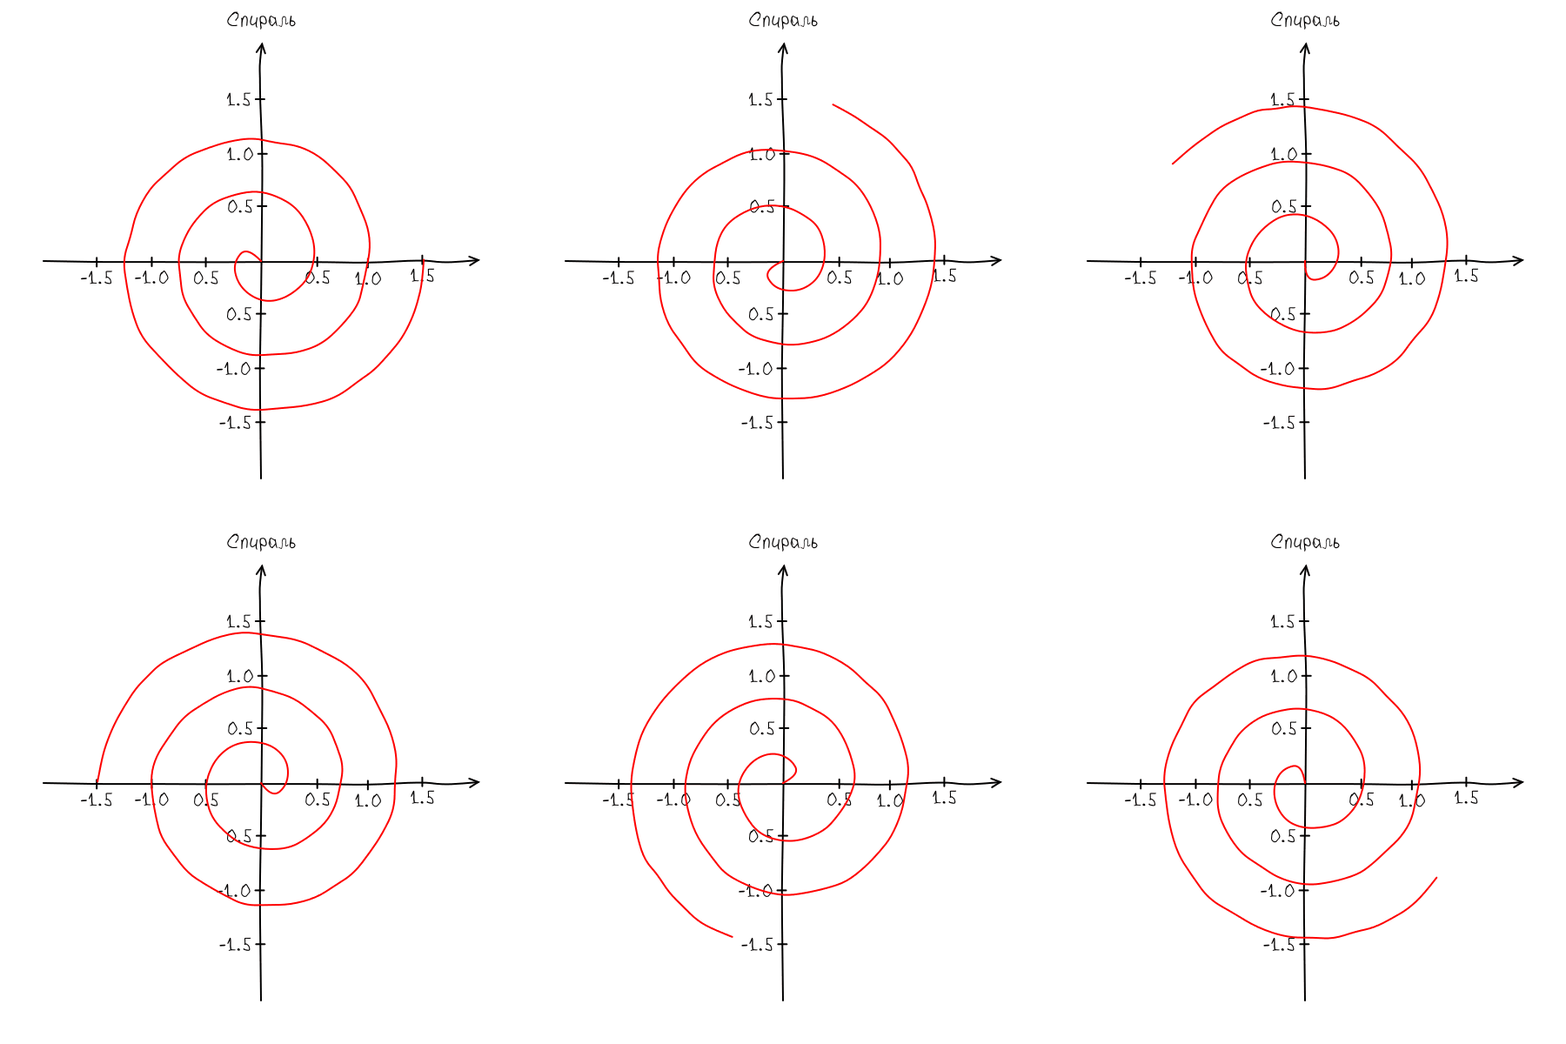
This module also can be used for animation of figure. The best way is prepare a separate script with drawing function.
The function must receive two arguments: a clumsy object and an animation param. So without any other dependencies this script can be used for rendering by both ways in a browser or node.js
Drawing script [spiral.js](examples/spiral.js):
```js
function Spiral(clumsy, phase){
clumsy.font('24px VoronovFont');
clumsy.clean('white');
clumsy.padding(50);
clumsy.range(-2, 2, -2, 2);
clumsy.lineWidth(2);
clumsy.radius(5);
clumsy.color('black');
clumsy.axis('x', -2, 2, 0.5);
clumsy.axis('y', -2, 2, 0.5);
var spiral = clumsy.tabulate(0, 3, 0.01, function(t){
var r = 0.5 * t;
return {
x: r * Math.cos(2 * Math.PI * t + phase),
y: r * Math.sin(2 * Math.PI * t + phase)
};
})
clumsy.color('red');
clumsy.draw(spiral);
clumsy.fillTextAtCenter('Спираль', clumsy.canvas.width/2, 30);
}
if(typeof module != 'undefined' && module.exports){
module.exports = Spiral;
}
```
Preview script for browser:
```html
spiral
var canvas = document.getElementById('canvas');
var clumsy = new Clumsy(canvas);
clumsy.font('12px VoronovFont');
var phase = 0;
setInterval(function(){
clumsy.seed(123);
clumsy.clear('white');
Spiral(clumsy, phase);
phase += Math.PI / 10;
}, 50);
```
Building script for node.js:
```js
var Canvas = require('canvas');
var GIFEncoder = require('gifencoder');
var path = require('path');
var fs = require('fs');
var Clumsy = require('clumsy');
var helpers = require('clumsy/helpers');
var Spiral = require('./spiral.js');
var canvas = new Canvas(600, 600);
var clumsy = new Clumsy(canvas);
clumsy.font('24px VoronovFont');
var encoder = helpers.prepareEncoder(GIFEncoder, canvas);
var phase = 0;
var n = 10;
encoder.start();
for(var i = 0; i < n; i++){
clumsy.seed(123);
clumsy.clear('white');
Spiral(clumsy, phase);
phase += 2 * Math.PI / n;
encoder.addFrame(clumsy.ctx);
};
encoder.finish();
```
The result:

## API
Creates new clumsy object.
* `canvas` - an instance of HTMLCanvas
```js
var clumsy = new Clumsy(canvas);
```
### axis(axis, start, end, [step | options]);
Draws axis.
* `axis` may be 'x', 'y', {x: 1, y: 1}
* `start`, `end` - range of axis
* `step` - step of scale
* `options` - sets of options allowed by method:
* `zero` - coordinates of zero point of the axis
* `step` - a step of the scale
* `limits` - limits of scale, [start + step, end - step] by default
* `hide_zero` - hides zero if true
* `tick_size` - size of scale ticks in px, default is 5px
* `mark` - a function that generate label for ticks
```js
// Draws axis from -1 to 1 without a scale
clumsy.axis('x', -1, 1);
// Draws axis from -1 to 1 with a scale and step 0.2
clumsy.axis('x', -1, 1, 0.2);
// Draws axis with custom options:
clumsy.axis('x', -1, 1, {
zero: {x: 0, y: 0}, // default
step: 0.1,
limits: [start + step, end - step],
hide_zero: true, // hide zero mark
tick_size: 5, // in px
mark: function(t){ // default
return parseInt(t) + '.' + parseInt(Math.abs(t*10) % 10)
}
});
```
### clean([color])
Updates the background color (if argument is not undefined) and cleans the canvas.
* `color` - new background color.
```js
clumsy.clean();
```
Draws a curve by array of point in `{x: x, y: y}` format.
* `curve` is [{x: x0, y: y0}, ... {x: xn-1, yn-1}]
```js
// Draws line from (0,0) to (1,1).
clumsy.draw([{x: 0, y:0}, {x: 1, y:1}]);
```
### fillTextAtCenter(x, y, text)
Draws text at center (x, y).
* x, y - coordinates of text center
* text - a text for drawing
```js
clumsy.fillTextAtCenter(100, 100, "Hello World!");
```
### overdraw(curve)
Draws a curve with clearing canvas under the curve by background color.
* `curve` is [{x: x0, y: y0}, ... {x: xn-1, yn-1}]
```js
// Draws line from (0,0) to (1,1)
clumsy.draw([{x: 0, y:0}, {x: 1, y:1}]);
// Overdraws line from (0,1) to (0,1)
clumsy.draw([{x: 1, y:0}, {x: 0, y:1}]);
```
### padding(size)
### padding(vertical, horizontal)
### padding(left, right, bottom, top)
Sets paddings from the edges of the canvas.
* `size` - size of all paddings
* `veritcal`, `horizontal` - vertical and horizontal paddings
* `left`, `right`, `bottom`, `top` - vertical and horizontal paddings
```js
// Sets all padding in 100px
clumsy.padding(100);
// Sets vertical paddings are 100px and horizontal are 200px
clumsy.padding(100, 200);
// Sets left, right, bottom and top paddings
clumsy.padding(50, 100, 150, 200);
```
### range(start, end)
### range(start0, end0, start1, start1)
Sets ranges of the coordinate system.
```js
// Sets same range for horizontal and vertical scales
clumsy.range(-10, 10);
// Sets horizontal [-10,10] and vertical [-20,20] ranges
clumsy.range(-10, 10, -20, 20);
```
### seed([seed])
Sets the seed of generator of pseudo random numbers.
```js
// Sets the seed
clumsy.seed(123456);
// Gets current seed
var seed = clumsy.seed();
```
### properties
Properties with setters/getters:
```js
// In pixels
clumsy.step(10);
clumsy.radius(10);
clumsy.defaultBoxAscent(16);
clumsy.lineWidth(1);
// CSS color
clumsy.background('white');
clumsy.color('black');
// CSS font
clumsy.font('12px Arial');
// Seed number for the built-in pseudo random generator
clumsy.seed(12345);
```
## License
[MIT](LICENSE)
[npm-image]: https://img.shields.io/npm/v/clumsy.svg
[npm-url]: https://npmjs.org/package/clumsy
[downloads-image]: https://img.shields.io/npm/dm/clumsy.svg
[downloads-url]: https://npmjs.org/package/clumsy
[travis-image]: https://img.shields.io/travis/kreshikhin/clumsy/master.svg
[travis-url]: https://travis-ci.org/kreshikhin/clumsy