Ecosyste.ms: Awesome
An open API service indexing awesome lists of open source software.
https://github.com/ksmnetwork/Total-Panic
https://github.com/ksmnetwork/Total-Panic
Last synced: 3 months ago
JSON representation
- Host: GitHub
- URL: https://github.com/ksmnetwork/Total-Panic
- Owner: ksmnetwork
- Created: 2021-08-25T22:02:35.000Z (over 3 years ago)
- Default Branch: main
- Last Pushed: 2022-05-02T23:18:55.000Z (over 2 years ago)
- Last Synced: 2024-08-02T19:33:53.938Z (6 months ago)
- Size: 27.3 KB
- Stars: 2
- Watchers: 1
- Forks: 0
- Open Issues: 0
-
Metadata Files:
- Readme: README.md
Awesome Lists containing this project
- awesome-dot - TotalPanic - Kusama and Polkadot Telemetry Analysis and Alerting. (Community Projects / Identity Registrars)
README
# TOTAL Panic #
### KUSAMA and PolkaDOT Telemetry Monitoring with Grafana Cloud and JSON API ###
Simple but powerfull KUSAMA and PolkaDOT Telemetry Analisys and Alerting
* Serverless
* Installationless
* Internet, required!
#### Steps: ####
* Create Grafana Cloud Account
* Install JSON API Plugin
* [JSON API Data Source for Grafana Documentation](https://marcus.se.net/grafana-json-datasource/)
* Add the preffered endpoint
* [PolkaDOT Candidates ](https://polkadot.w3f.community/candidates)
* ``` https://polkadot.w3f.community/candidates ```
* [KUSAMA Candidates](https://kusama.w3f.community/candidates)
* ``` https://kusama.w3f.community/candidates ```
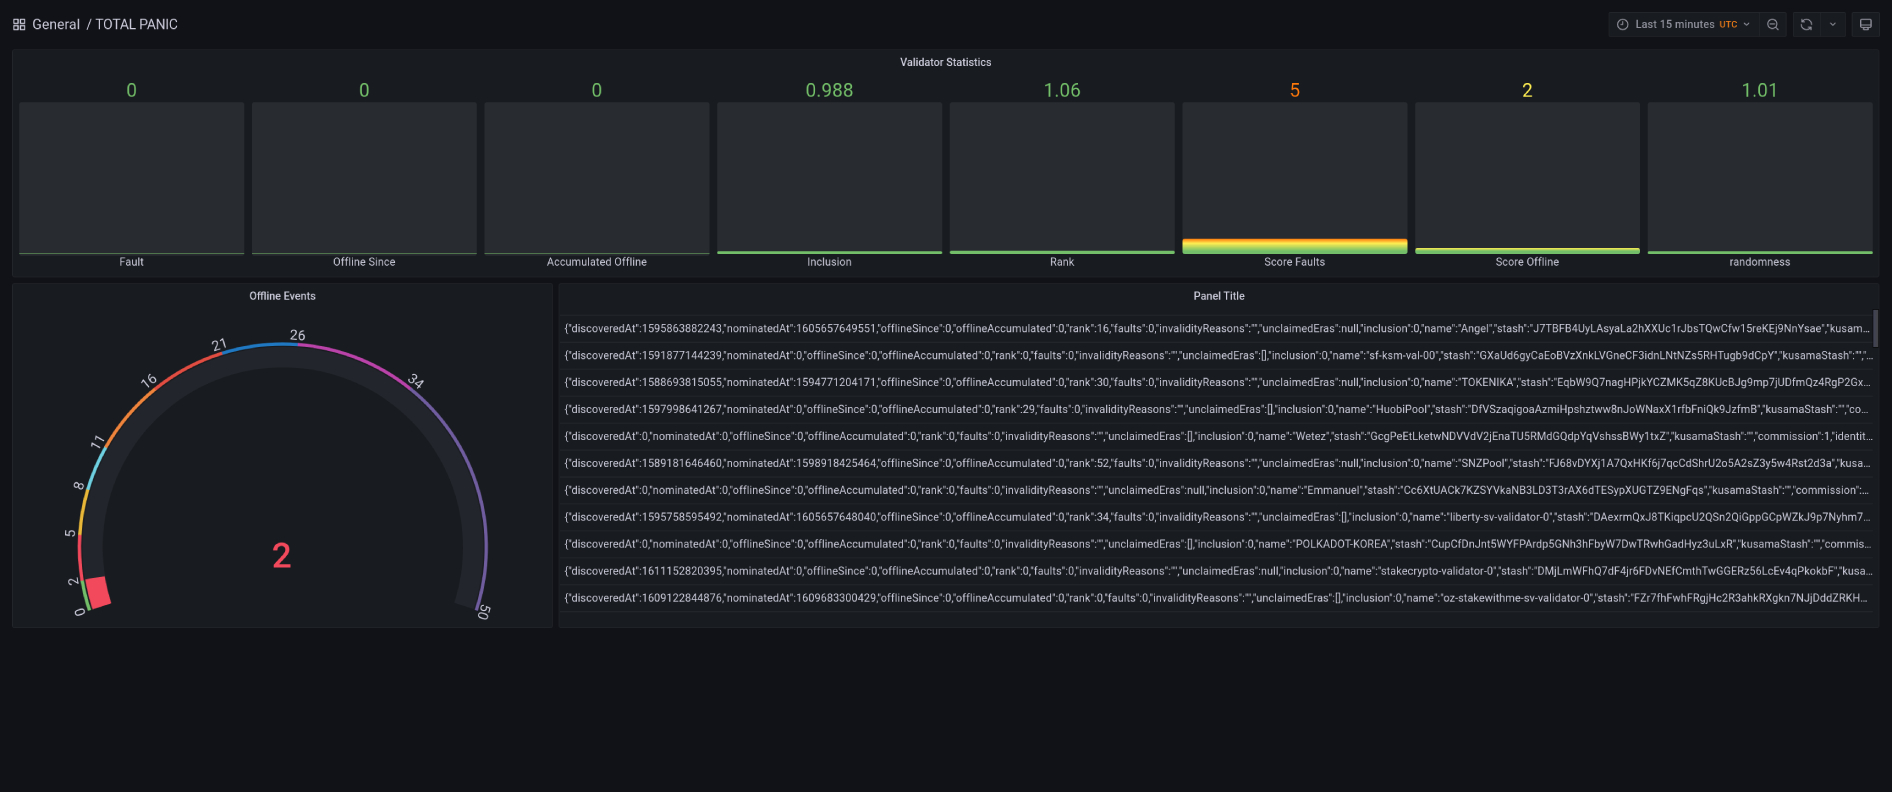
* Add the Simple Dashboard [Dashboard](https://grafana.com/grafana/dashboards/14921)
* Set your notifiers, there is many of them in one place
* Check the live demo [Snapshot - Aug 26](https://ksmnetwork.grafana.net/dashboard/snapshot/dv1qCRgvQidjZltc0PEpGWsStBxpRzCY?orgId=1&refresh=30s)

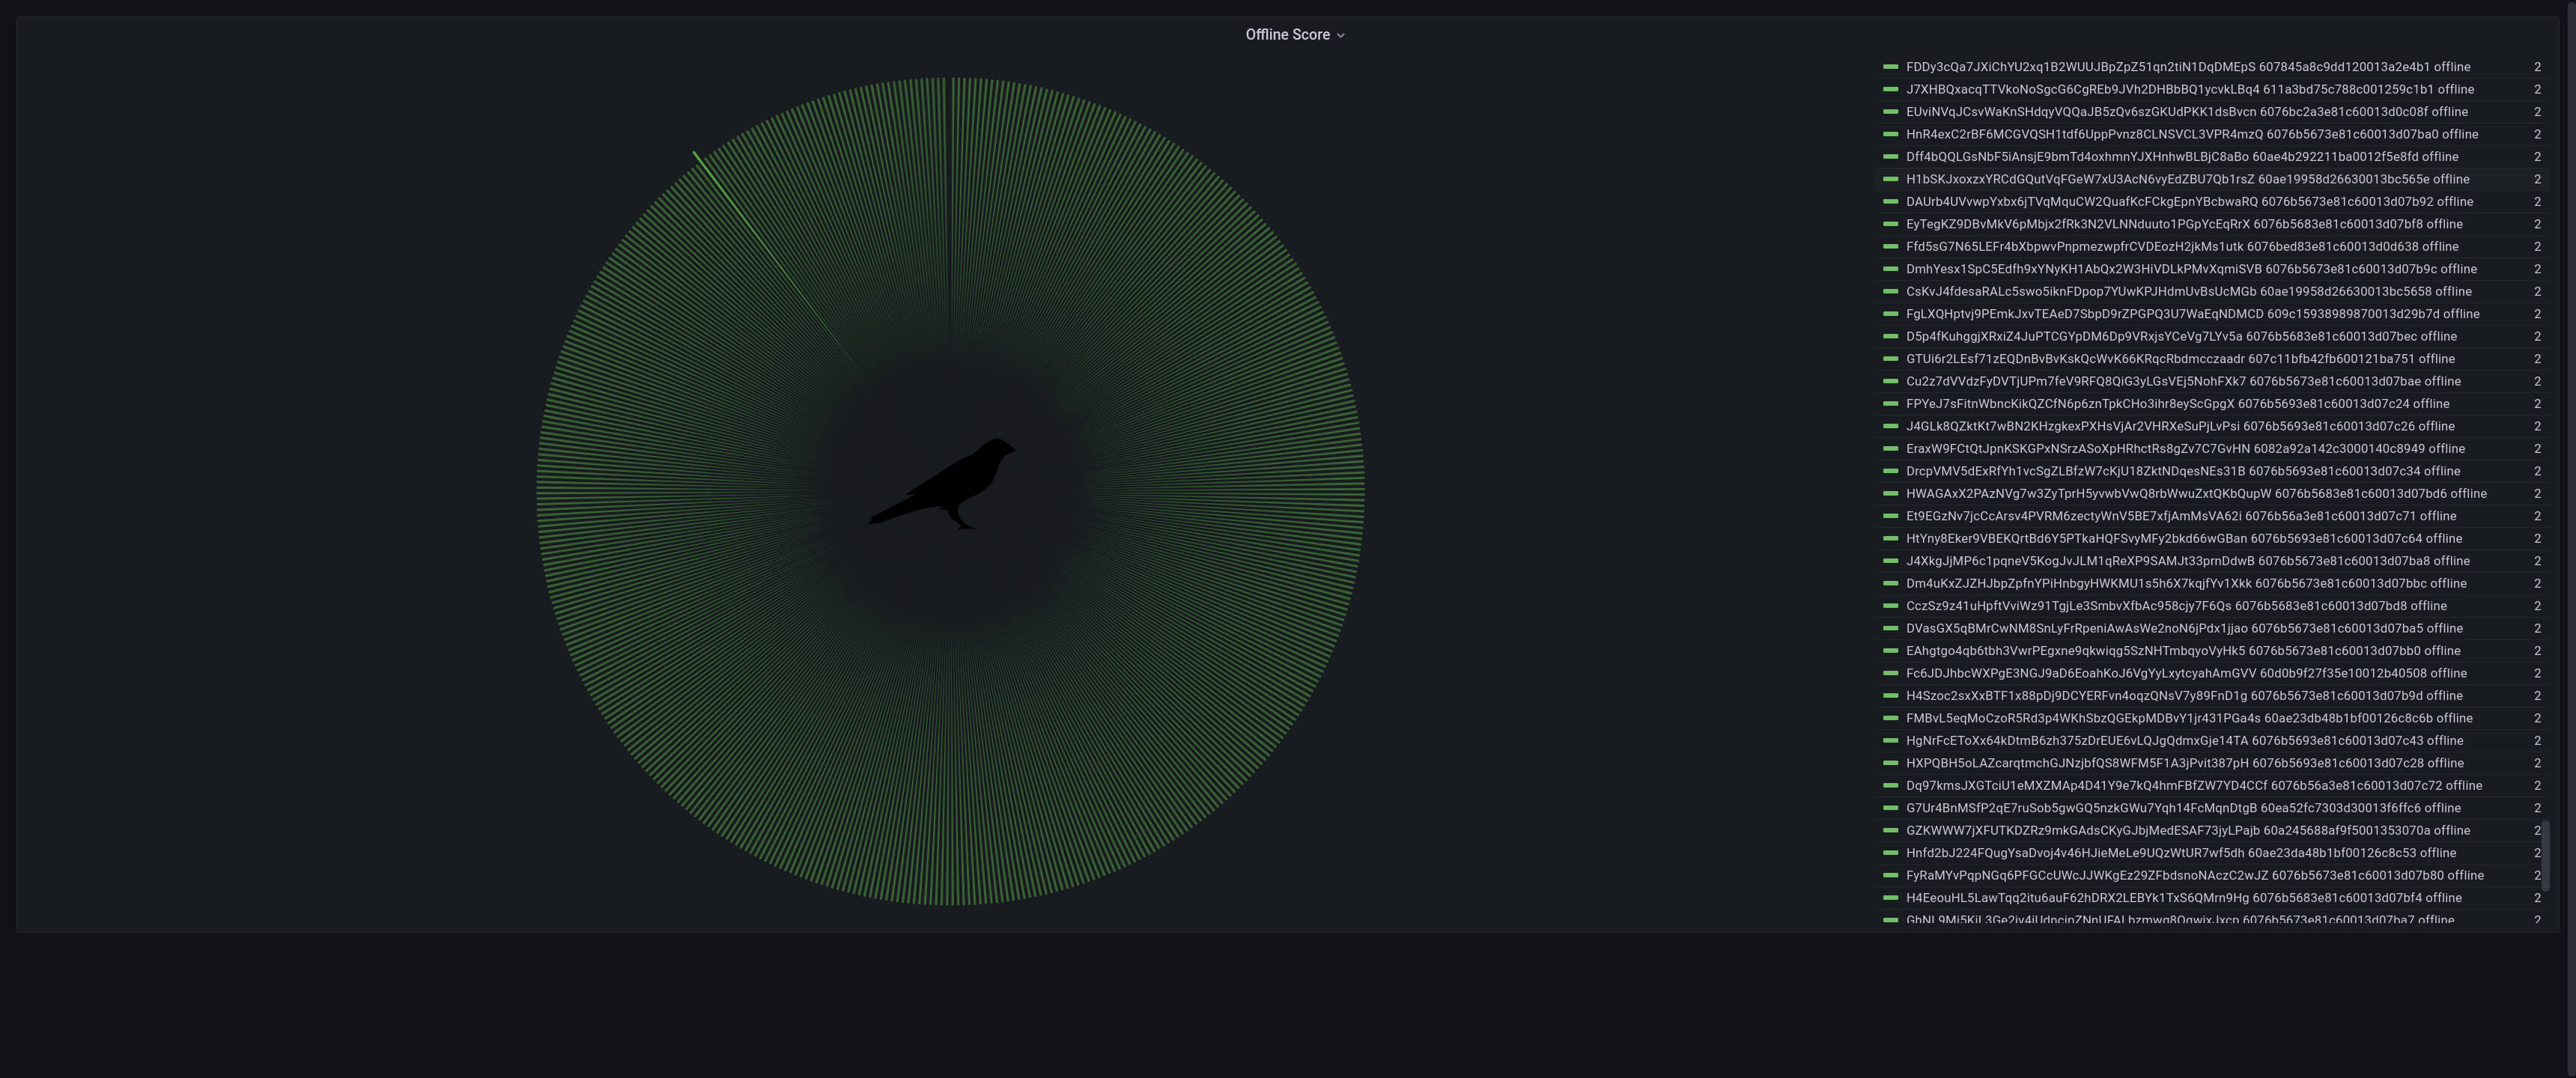
### The eye of Kusama :bird: ###
###### Validators Score Overview ######
* [Starter dashboard](https://grafana.com/grafana/dashboards/14923)
* [Score overview snapshot](https://snapshot.raintank.io/dashboard/snapshot/EMURkx4OnIWKaRTkTdaBQLmUnWC9N6tb)


##### Settings #####
> Set your settings to obtain the information at least on minimum 5m to do not DDos it.
> Grafana sets also quite small timeouts check them as well
> Filter is casesensitive
> Alerts well this is up to you, since there is more then 10+ popular integrations with Telegram, DIscord, Webhooks and many more
##### List of supported notifiers #####
* DingDing dingding yes, external only no
* Discord discord yes no
* Email email yes no
* Google Hangouts Chat googlechat yes, external only no
* Hipchat hipchat yes, external only no
* Kafka kafka yes, external only no
* Line line yes, external only no
* Microsoft Teams teams yes, external only no
* Opsgenie opsgenie yes, external only yes
* Pagerduty pagerduty yes, external only yes
* Prometheus Alertmanager prometheus-alertmanager yes, external only yes
* Pushover pushover yes no
* Sensu sensu yes, external only no
* Sensu Go sensugo yes, external only no
* Slack slack yes no
* Telegram telegram yes no
* Threema threema yes, external only no
* VictorOps victorops yes, external only yes
* Webhook webhook yes, external only yes
* Zenduty webhook yes, external only yes
---
# For Support && Nominations #
* Display name. KSMNETWORK && KSMNETWORK-WEST
* Email [email protected]
* Riot @gtoocool:matrix.org
* KUSAMA (KSM) Address
* ```H1bSKJxoxzxYRCdGQutVqFGeW7xU3AcN6vyEdZBU7Qb1rsZ```
* PolkaDOT (DOT) Address:
* ```15FxvBFDd3X7H9qcMGqsiuvFYEg4D3mBoTA2LQufreysTHKA```
* https://ksm.network