https://github.com/kuranez/eu-energy-map
Dashboard visualizing renewable energy trends in the European Union.
https://github.com/kuranez/eu-energy-map
dashboard dashboards data-analysis data-visualization energy-data european-union geopandas green-energy interactive-map map pandas plotly python renewable-energy renewables web-app
Last synced: 2 months ago
JSON representation
Dashboard visualizing renewable energy trends in the European Union.
- Host: GitHub
- URL: https://github.com/kuranez/eu-energy-map
- Owner: kuranez
- License: mit
- Created: 2024-10-19T22:38:48.000Z (over 1 year ago)
- Default Branch: main
- Last Pushed: 2025-11-18T15:07:46.000Z (8 months ago)
- Last Synced: 2025-11-18T17:08:38.219Z (8 months ago)
- Topics: dashboard, dashboards, data-analysis, data-visualization, energy-data, european-union, geopandas, green-energy, interactive-map, map, pandas, plotly, python, renewable-energy, renewables, web-app
- Language: Python
- Homepage: https://apps.kuracodez.space/eu-energy-map/
- Size: 18.4 MB
- Stars: 0
- Watchers: 1
- Forks: 0
- Open Issues: 1
-
Metadata Files:
- Readme: README.md
- License: LICENSE
Awesome Lists containing this project
README
# EU Energy Map


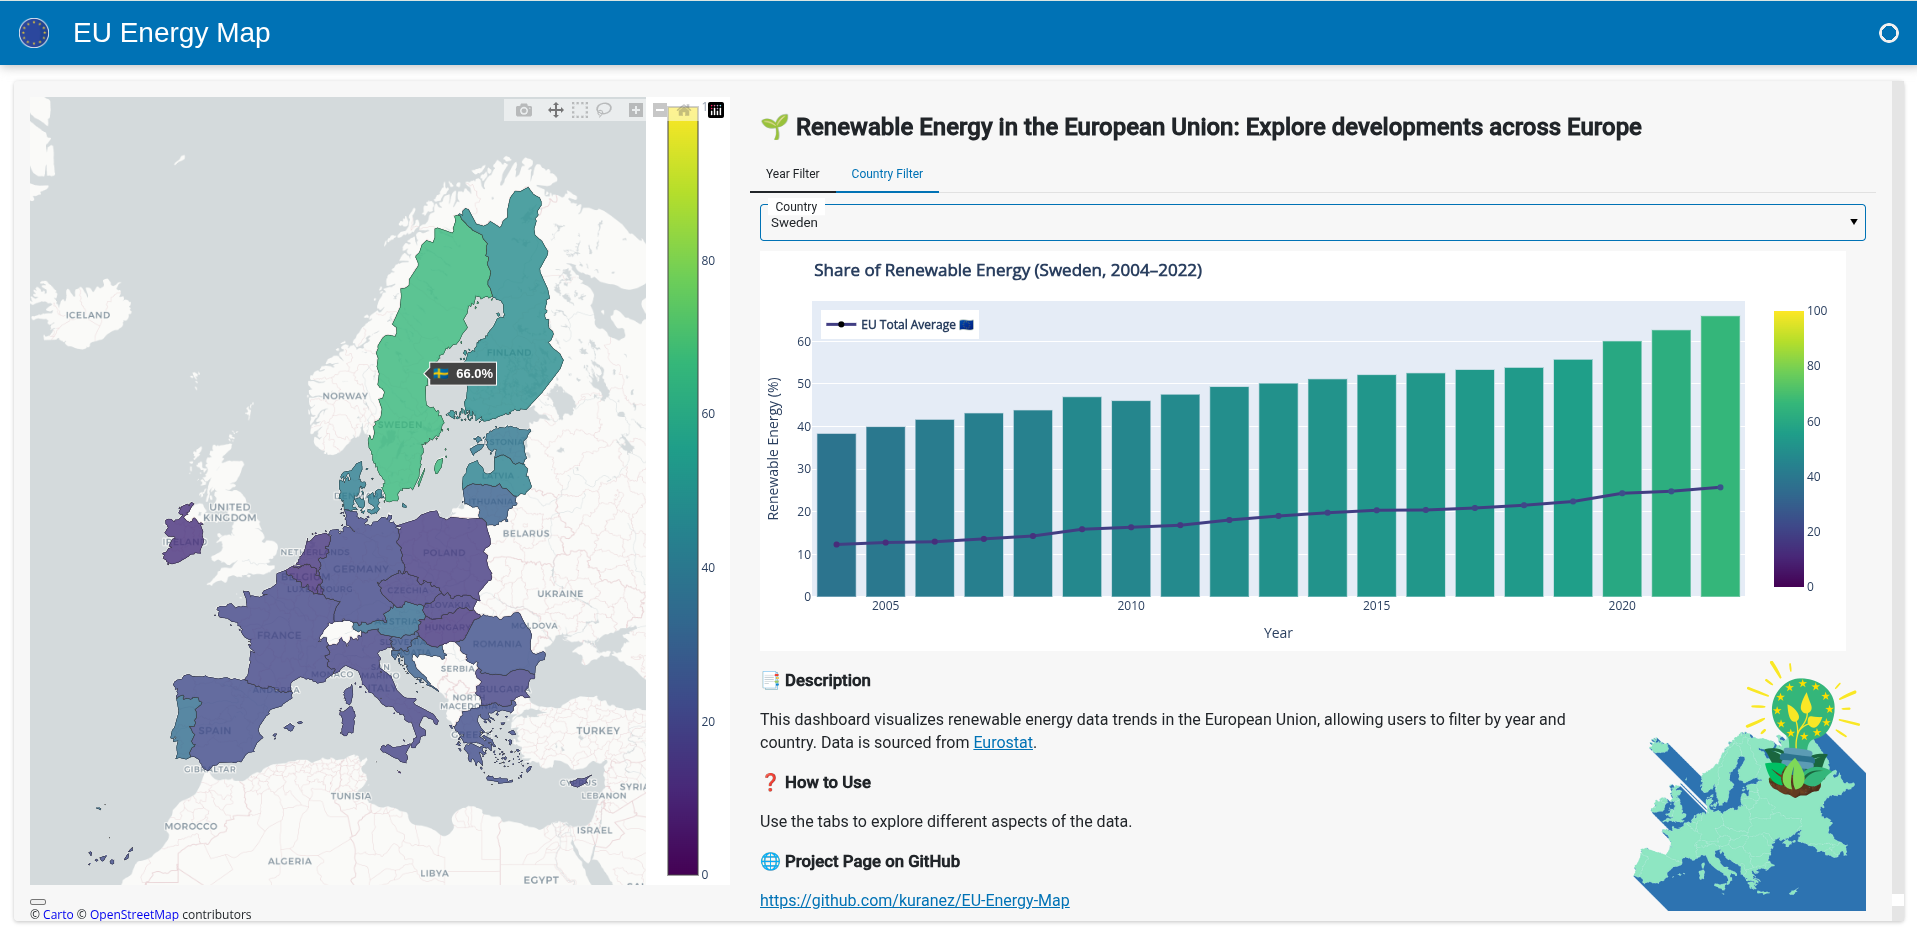
An interactive dashboard that visualizes Eurostat data on renewable energy developments across European countries. Built with Python and Panel, the web app provides an intuitive interface to explore renewable energy trends from 2004 to 2022.
## 🌐 Web App
> [](https://apps.kuracodez.space/eu-energy-map/app)
>
> **Try the app - explore renewable energy data for Europe directly in your browser.**
## Screenshot
> 
---
## ⚙️ Features
- Interactive dashboard powered by **Panel** and **Plotly**
- Time-series visualization of renewable energy shares by country and category
- Geospatial mapping using **GeoJSON** and **GeoPandas**
- Downloadable datasets and smooth filtering options
### Example Charts
---
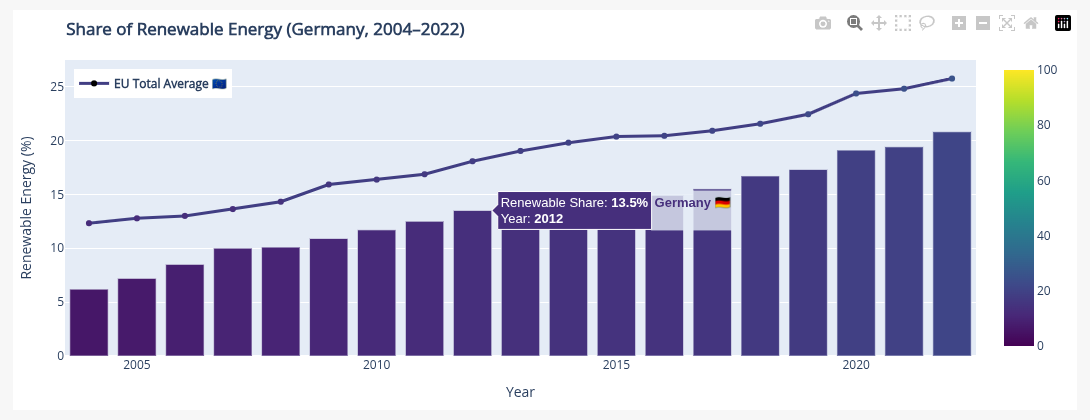
#### ➤ Renewable Energy Share Per Year
---
---
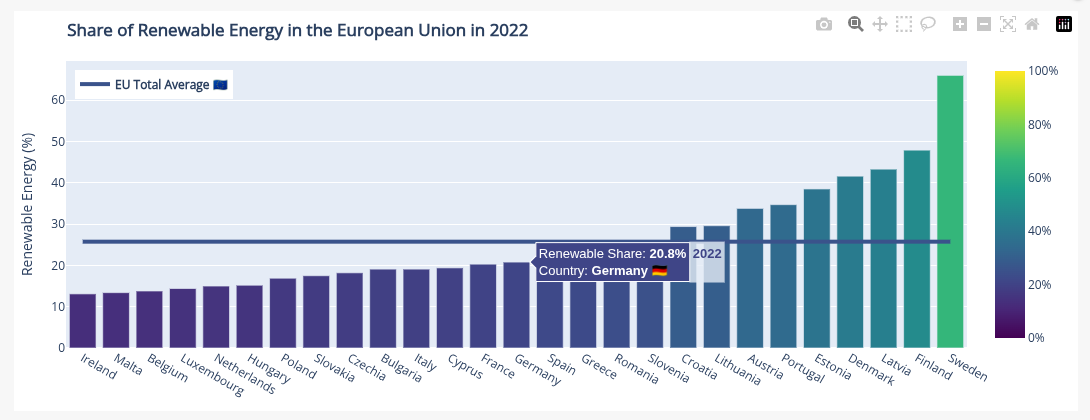
#### ➤ Renewable Energy Share Per Country
---
---
### Recent Changes
---
**Bar Charts**
- Unified display of **EU Total Average** across all charts, with a toggle option to show/hide it.
- Minor improvements to hover templates and trace labels.
**Map**
- Implemented hover templates displaying **country flags and data**.
- Recentered map and adjusted zoom.
- Added layout spacers for improved alignment.
**Description**
- Added basic **usage instructions** to the dashboard.
- Added emojis and graphics.
**Layout & Dashboard**
- Reorganized dashboard components for **better clarity and user experience**.
- Minor improvements to scaling.
**File Structure**
- Reorganization of file structure to me more **modular and easier to expand**.
---
## 📦 Python Dependencies
- **Core:** `os`, `json`
- **Data Handling:** `pandas`, `geopandas`
- **Visualization:** `plotly.express`, `plotly.graph_objects`, `plotly.io`
- **Dashboard UI:** `panel`
---
## 📊 Datasets
### 1. Renewable Energy Data (Eurostat)
- **File:** `nrg_ind_ren_linear.csv`
- **Source:** [Eurostat – Renewable Energy](https://ec.europa.eu/eurostat/databrowser/view/nrg_ind_ren/default/table?lang=en)
- **Years:** 2004–2022
- **Columns:** Country codes, energy type, unit, value (%), flags
- **Categories:** Total renewables, electricity, heating/cooling, transport
### 2. Geographic Boundaries (GISCO - Eurostat)
- **File:** `europe.geojson`
- **Source:** [GISCO – Eurostat](https://ec.europa.eu/eurostat/web/gisco/geodata/administrative-units/countries)
- **Year:** 2024
- **Format:** GeoJSON (EPSG:4326), scale 1:20M
---
## 📁 File Structure
```yaml
EU-Energy-Map/
├── app.py # Main dashboard entry point
├── config.py # Configurations (tokens, paths, etc)
├── data/
│ ├── loader.py # Loads and merges CSV/GeoJSON data
│ ├── filters.py # Preprocessing and filtering logic
│ └── nrg_ind_ren_linear.csv # Eurostat renewable energy data
├── components/
│ ├── charts/
│ │ ├── bar_chart_by_country.py # Bar chart: Country vsU
│ │ └── bar_chart_by_year.py # Bar chart: All countries by year
│ ├── map.py # Interactive choropleth map
│ └── widgets.py # Dashboard widgets (sliders, selectors)
├── layout/
│ └── dashboard.py # Layout composition for Panel
├── utils/ # Helper functions
│ ├── colors.py # Color scales & conversion
│ └── flags.py # ISO2 code → emoji flag
├── assets/
│ ├── europe-renewables-500px.png # Dashboard image
│ └─── logo-500px.png # Logo
└── geo/
└── europe.geojson # European country boundaries (GeoJSON)
```
---
## 📙 Documentation
**Code documentation is provided as a Jupyter notebook.**
You can view it here: [documentation.ipynb](documentation.ipynb)
## 📕 Resources
> - [Holoviz Panel](https://panel.holoviz.org/) – A powerful Python framework for creating interactive web apps and dashboards, used for the UI in this project.
> - [Pandas](https://pandas.pydata.org/) – Essential for data manipulation and analysis, enabling efficient handling of Eurostat datasets.
> - [Geopandas](https://geopandas.org/) – Extends pandas to support geospatial data, making it easy to work with geographic boundaries and mapping.
> - [Jupyter](https://jupyter.org/) - An interactive environment for running Python code in notebooks, ideal for experimentation, documentation, and prototyping scripts.
> - [Docker Documentation](https://docs.docker.com/) - Official guides for containerizing, deploying, and running this app consistently across different environments.
## 📘 License
This project is open source and available under the **MIT License**.
You may modify, distribute, and use it freely in your own projects.
---
## 📓 Jupyter Notebook Version (Previous Release)
A standalone Jupyter Notebook version of the EU Energy Map dashboard is available from a previous release:
> [**Download Notebook Release v1.1**](https://github.com/kuranez/eu-energy-map/releases/tag/nb-1.1)
- Run the notebook locally to explore and visualize Eurostat renewable energy data without setting up the full web app.
- Includes interactive charts and geospatial mapping using the same datasets.
- Ideal for experimentation, prototyping, or educational use.
---
## 🔗 Related Projects
If you're working with Eurostat TSV datasets and need a tool for quick conversion to CSV, check out my companion project:
➡️ **[TSV-CSV Converter](https://github.com/kuranez/TSV-CSV-Converter)** – A lightweight utility to convert Eurostat-style `.tsv` files into clean `.csv` format.
---