https://github.com/kuranez/krypto-dashboard
Cryptocurrency Dashboard displaying price and volume information for BTC, ETH, BNB using Python, Jupyter Notebooks and the Binance API.
https://github.com/kuranez/krypto-dashboard
anaconda-cloud binance-api cryptocurrency dashboard finance holoviz-panel jupyter pandas plotly python
Last synced: 4 months ago
JSON representation
Cryptocurrency Dashboard displaying price and volume information for BTC, ETH, BNB using Python, Jupyter Notebooks and the Binance API.
- Host: GitHub
- URL: https://github.com/kuranez/krypto-dashboard
- Owner: kuranez
- Created: 2024-08-14T17:45:16.000Z (almost 2 years ago)
- Default Branch: main
- Last Pushed: 2025-12-04T19:58:48.000Z (6 months ago)
- Last Synced: 2025-12-08T03:44:37.679Z (6 months ago)
- Topics: anaconda-cloud, binance-api, cryptocurrency, dashboard, finance, holoviz-panel, jupyter, pandas, plotly, python
- Language: Jupyter Notebook
- Homepage: https://apps.kuracodez.space/krypto-dashboard/main
- Size: 6.63 MB
- Stars: 1
- Watchers: 1
- Forks: 0
- Open Issues: 0
-
Metadata Files:
- Readme: README.md
Awesome Lists containing this project
README
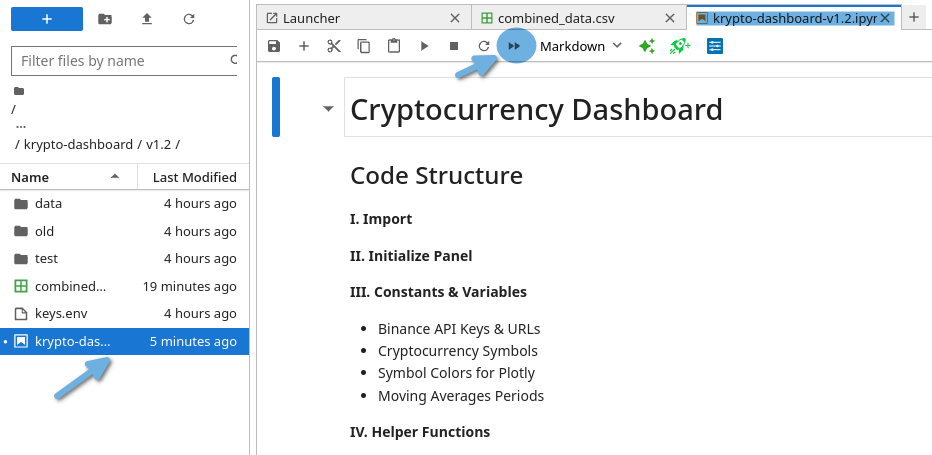
# Cryptocurrency Dashboard
Simple finance dashboard to track and compare cryptocurrency prices written in Python.
**New Project** (based on this one) https://github.com/kuranez/krypto-dashboard-webapp
**Update:**
**Complete overhaul in v1.2!**
- Extensive Jupyter Notebook with full documentation.
- Use as a basis and create your own python script using the components you need.
**Features:**
- Fetch cryptocurrency data from *Binance*.
- Store API-Keys securely using *dotenv*.
- Helper functions to extract data and save to *CSV*.
- Explore dataframes in *Tabulate*.
- Create plots in *Plotly*.
- Build dashboard in *Panel*.
## WebApp
Simple example dashboard (*crypto_prices_over_time.ipynb*) is hosted on Anaconda Cloud.
[View Demo Dashboard App on Anaconda Cloud!](https://supportive-cuban-boa.anacondaapps.cloud/crypto_prices_over_time)
## Requirements & Installation
### List of Python packages
- load_dotenv
- datetime
- pandas
- panel
- plotly
- matplotlib
---
### Installation
Install with **pip**:
``pip install ``
Install with **conda**:
``conda install --channel=conda-forge ``
---
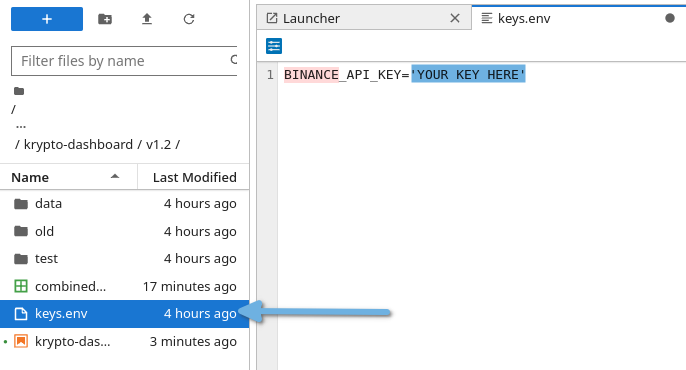
### Binance API Key
Store your Public Binance API-Key in **keys.env**.
---
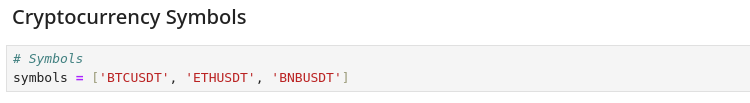
### Add Cryptocurrency Symbols
Go to **Add Symbol** section of the notebook and add custom Crypto-USDT-pairs.
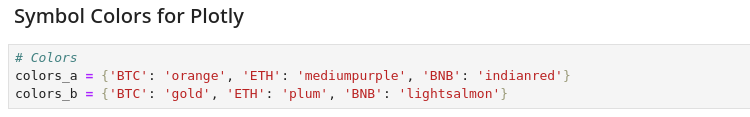
Pick custom colors for plotly using the matplotlib colors library and add to colors dictionaries.
[https://matplotlib.org/stable/gallery/color/named_colors.html](https://matplotlib.org/stable/gallery/color/named_colors.html)
---
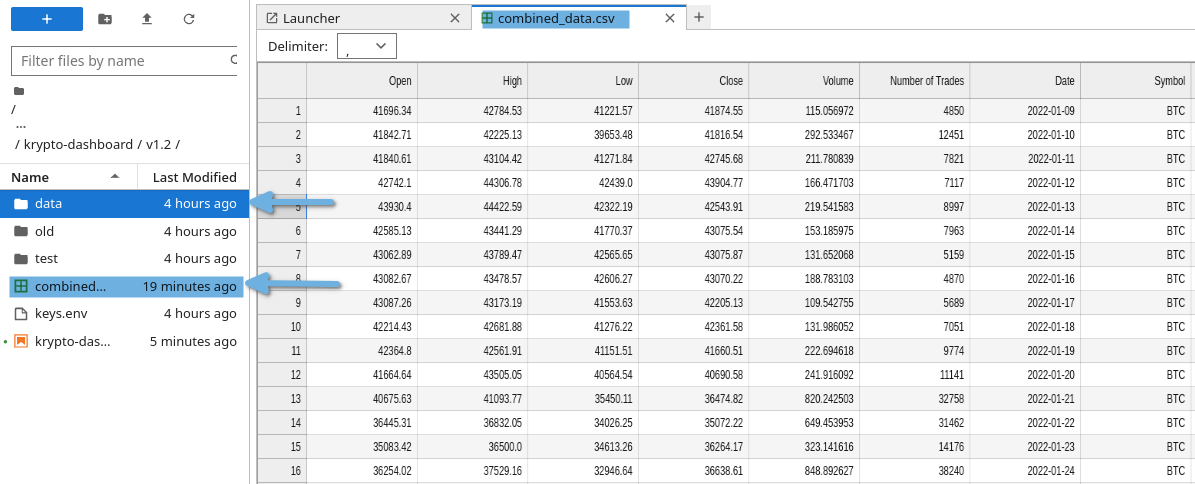
### Example Datasets
Example data sets are available.
---
### Run Notebook
Run all cells first to guarantee full functionality.
---
## Features
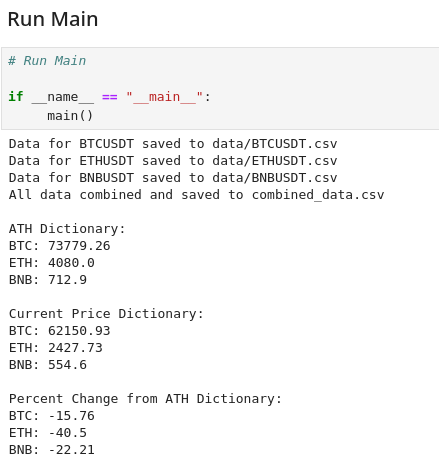
### Overview
Grab and check all data you need using the **Main Function**.
---
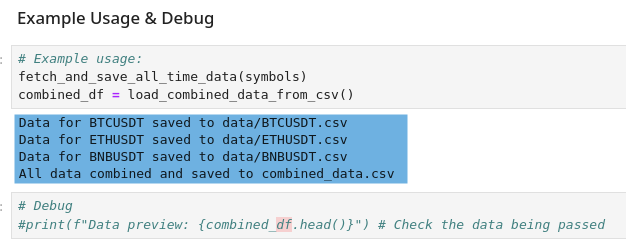
### Save Data to CSV
Save data locally as a csv file.
---
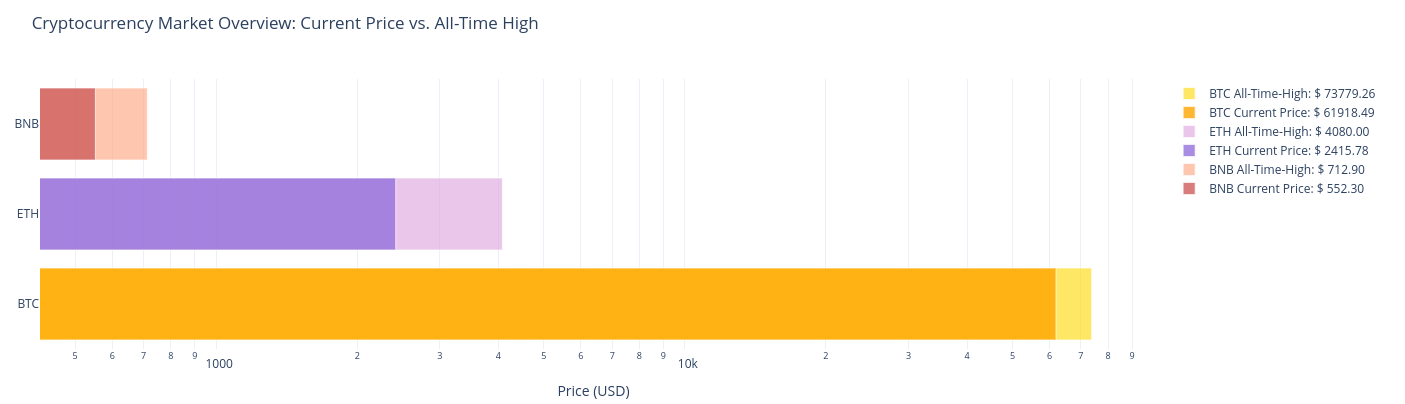
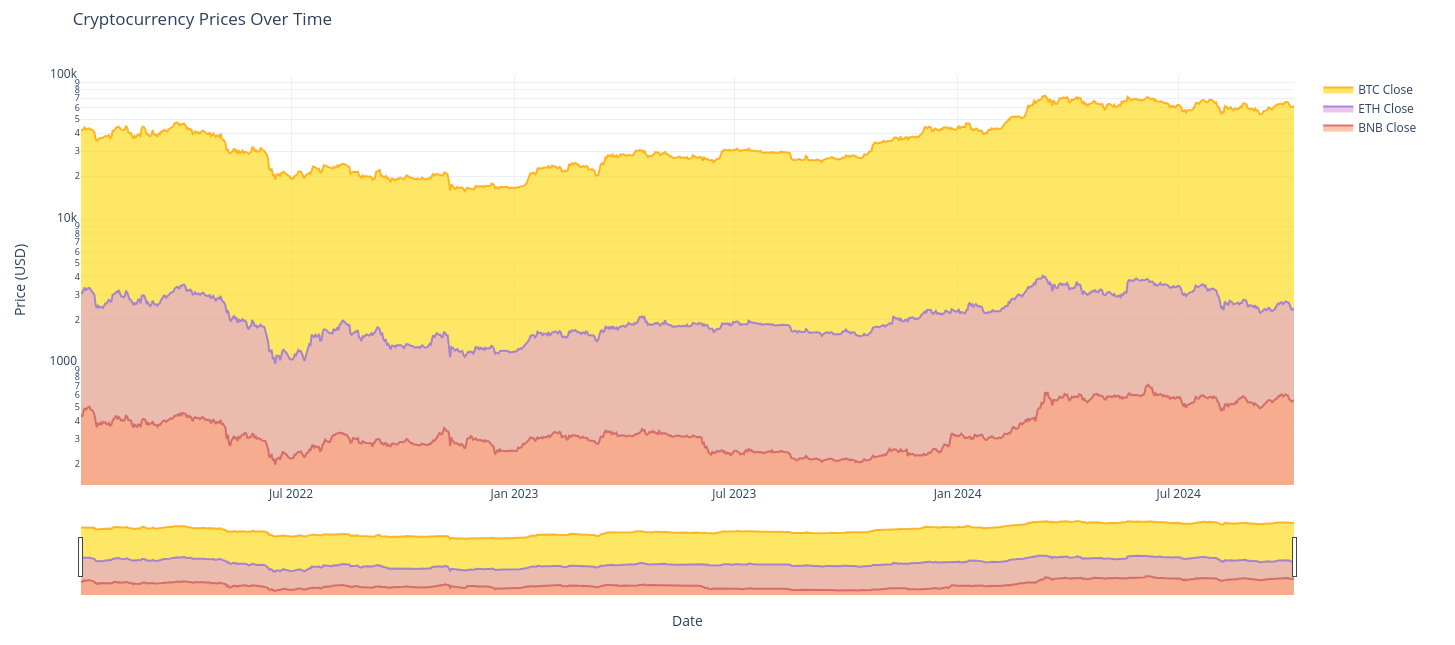
### Price Plots
Generate nice looking charts with Plotly.
#### Market Overview Figures
---
----
---
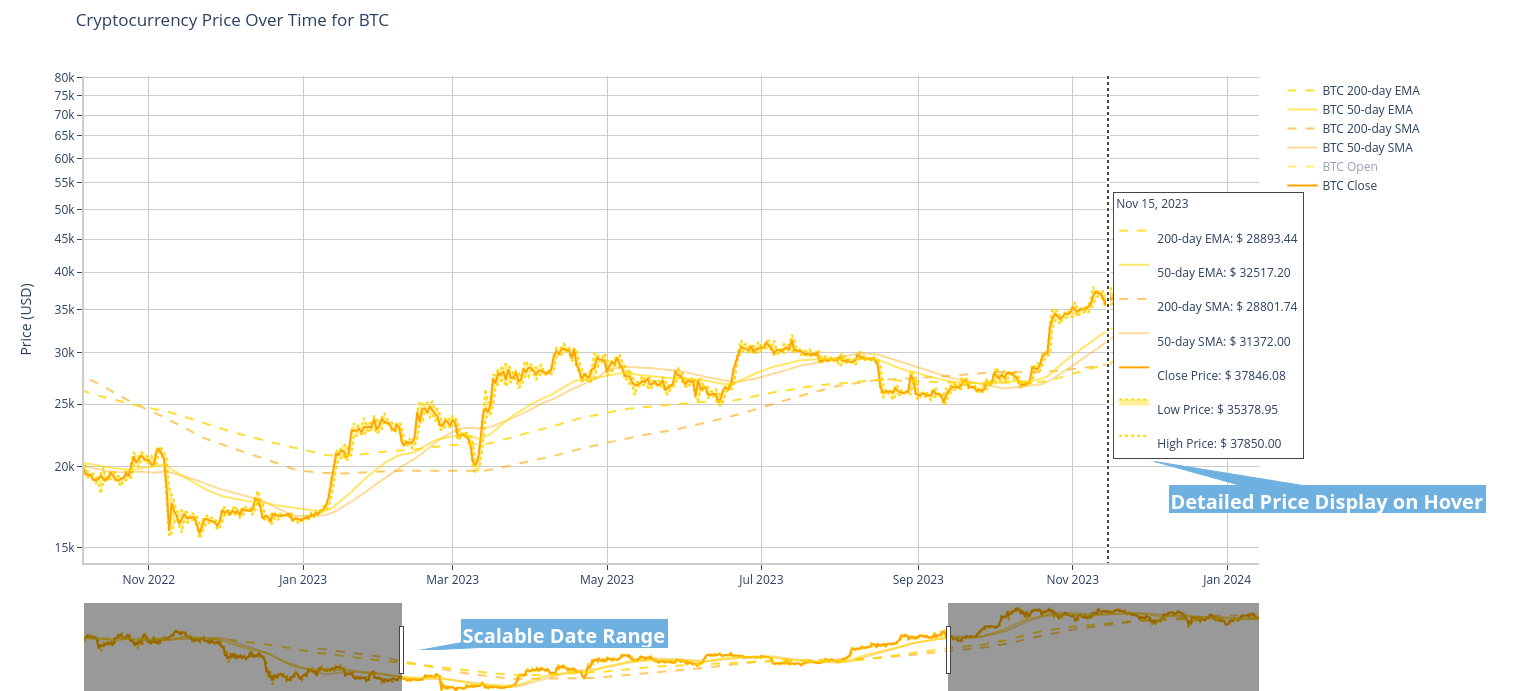
#### Interactive Price Charts
---
---
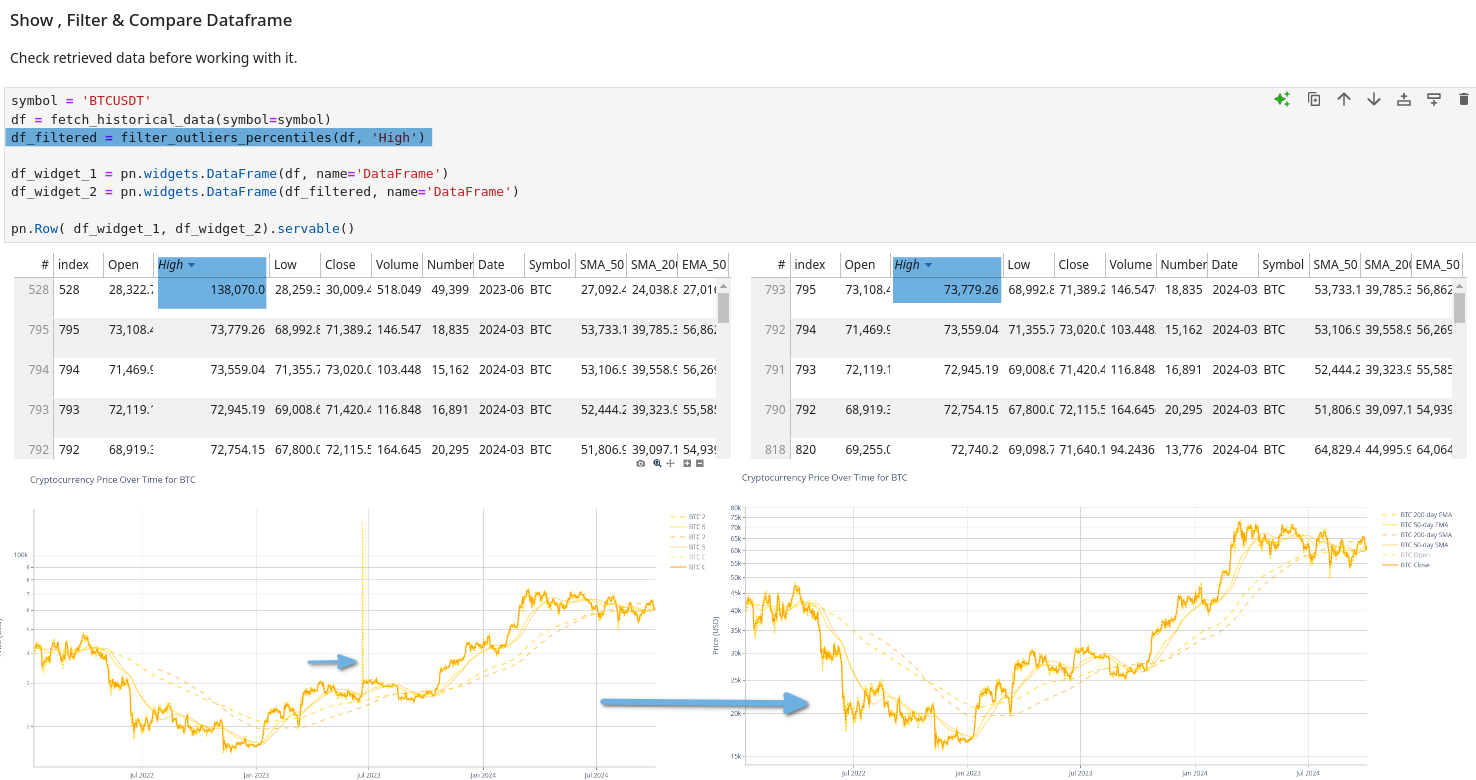
### Explore DataFrames in Tabulate
Explore & Compare data tables and apply filters if necessary.
---
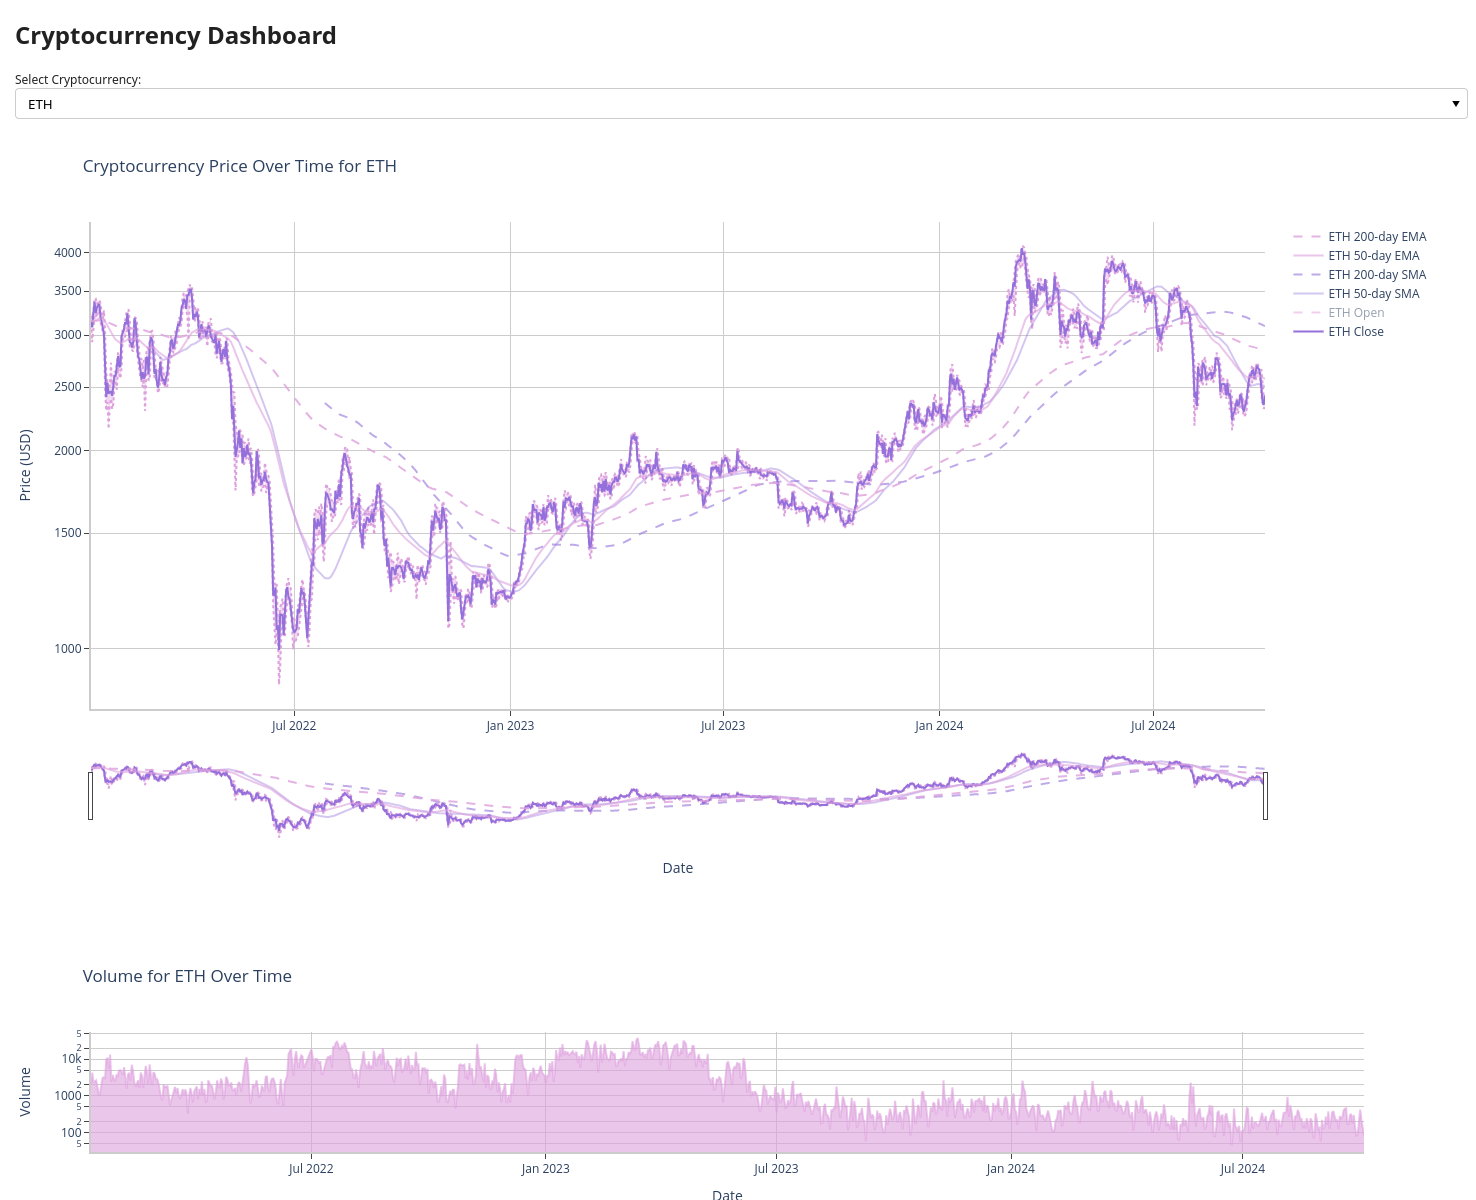
### Interactive Widgets
Use interactive widgets to explore data in **Jupyter Notebook** or build a **Dashboard App** using **Panel**.
---
## Resources
- [JupyterLab - Scientific Python Notebook Suite](https://jupyter.org/)
- [HoloViz Panel Data Exploration & Web App Framework for Python](https://panel.holoviz.org/index.html)
- [Plotly Open Source Graphing Library for Python](https://plotly.com/python/)
- [Matplotlib Color Gallery](https://matplotlib.org/stable/gallery/color/named_colors.html)