https://github.com/kuskoman/logstash-exporter
Prometheus exporter for Logstash written in Go
https://github.com/kuskoman/logstash-exporter
golang logstash prometheus prometheus-exporter prometheus-metrics
Last synced: 5 months ago
JSON representation
Prometheus exporter for Logstash written in Go
- Host: GitHub
- URL: https://github.com/kuskoman/logstash-exporter
- Owner: kuskoman
- License: mit
- Created: 2023-02-11T13:59:33.000Z (over 3 years ago)
- Default Branch: master
- Last Pushed: 2026-01-11T10:28:16.000Z (5 months ago)
- Last Synced: 2026-01-11T15:29:01.552Z (5 months ago)
- Topics: golang, logstash, prometheus, prometheus-exporter, prometheus-metrics
- Language: Go
- Homepage:
- Size: 7.92 MB
- Stars: 90
- Watchers: 3
- Forks: 28
- Open Issues: 14
-
Metadata Files:
- Readme: README.md
- Contributing: CONTRIBUTING.md
- License: LICENSE
- Security: SECURITY.md
Awesome Lists containing this project
README
# Logstash-exporter
[](https://codecov.io/gh/kuskoman/logstash-exporter)
Export metrics from Logstash to Prometheus.
The project was created as rewrite of existing awesome application
[logstash_exporter](https://github.com/BonnierNews/logstash_exporter),
which was also written in Go, but it was not maintained for a long time.
A lot of code was reused from the original project.
**Important:** V2 version of the application is currently in beta. It is recommended to use V1 version in production.
It is still maintained and available under [v1 branch](https://github.com/kuskoman/logstash-exporter/tree/v1).
Make sure to check the [Migration](#migration) section before upgrading to V2.
**Important:** Because of limited workforces, this project is tested only against a single Logstash version.
You can check the tested version in [docker-compose.yml](./docker-compose.yml) file.
Using this exporter with other versions of Logstash may not work properly (although most of the metrics should work).
## Usage
### Running the app
The application can be run in several ways:
- Using the binary executable as a standalone application (e.g., with systemd)
- Using the Docker image
- Using the Helm chart for Kubernetes deployments
For detailed deployment instructions, see:
- [Standalone Deployment Guide](./STANDALONE.md) - For deploying as a systemd service
- [Helm Deployment Guide](./HELM-DEPLOY.md) - For deploying to Kubernetes using Helm
- [Helm chart auto-generated README](./chart/README.md) - For Helm chart configuration
- [Helm chart tests](./chart/tests/README.md) - For Helm chart unit tests
### Kubernetes Controller Mode
Logstash Exporter provides a Kubernetes Controller mode that can automatically discover and monitor Logstash instances running in Kubernetes. This mode works by:
1. Watching Kubernetes resources (pods, services) with specific annotations
2. Dynamically configuring the exporter to scrape metrics from these instances
3. Automatically updating the monitored targets when resources are created, updated, or deleted
To use this mode:
1. Deploy logstash-exporter with the Kubernetes controller enabled:
```yaml
logstash:
kubernetes:
enabled: true
namespaces: ["default", "monitoring"] # Optional: specific namespaces to watch
resources:
pods:
enabled: true # Enable monitoring pods (default)
services:
enabled: true # Enable monitoring services
```
2. Set the appropriate RBAC permissions:
```yaml
serviceAccount:
create: true
enabled: true
rbac:
create: true
```
3. Add annotations to your Kubernetes resources:
For pods:
```yaml
metadata:
annotations:
logstash-exporter.io/url: "http://localhost:9600"
# Optional auth credentials
logstash-exporter.io/username: "user"
logstash-exporter.io/password: "pass"
```
For services (useful for clustered Logstash with stable endpoints):
```yaml
kind: Service
metadata:
annotations:
logstash-exporter.io/url: "http://logstash-headless:9600"
spec:
selector:
app: logstash
```
4. The controller uses a separate Docker image (`kuskoman/logstash-exporter-controller`). If you need to specify a custom controller image:
```yaml
image:
repository: "kuskoman/logstash-exporter"
controllerRepository: "custom/logstash-exporter-controller"
```
For more details, see the Helm chart configuration.
### Flags
The application supports the following flags:
- `-config`: Path to the configuration file (default: `config.yml`). Takes precedence over `EXPORTER_CONFIG_LOCATION` environment variable.
- `-help`: Show help message.
- `-version`: Show semantic version.
#### Binary Executable
The binary executable can be downloaded from the [releases page](https://github.com/kuskoman/logstash-exporter/releases).
Linux binary is available under `https://github.com/kuskoman/logstash-exporter/releases/download/v${VERSION}/logstash-exporter-linux`.
The binary can be run without additional arguments, as the configuration is loaded from the `.env` file and environment variables.
Each binary should contain a SHA256 checksum file, which can be used to verify the integrity of the binary.
VERSION="test-tag" \
OS="linux" \
wget "https://github.com/kuskoman/logstash-exporter/releases/download/${VERSION}/logstash-exporter-${OS}" && \
wget "https://github.com/kuskoman/logstash-exporter/releases/download/${VERSION}/logstash-exporter-${OS}.sha256" && \
sha256sum -c logstash-exporter-${OS}.sha256
It is recommended to use the binary executable in combination with the [systemd](https://systemd.io/) service.
The application should not require any of root privileges, so it is recommended to run it as a non-root user.
##### Unstable (master) version
The unstable version of the application can be downloaded from the
[GitHub Actions](https://github.com/kuskoman/logstash-exporter/actions?query=branch%3Amaster+workflow%3A%22Go+application+CI%2FCD%22).
The latest successful build can be found under the `Go application CI/CD` workflow (already selected in the link).
To download the binary, simply go to the link location, click on the latest successful build, and download the binary
from the `Artifacts` section on the bottom of the page.
You are able to download artifact from any workflow run, not only master branch. To do that, go to
[GitHub Actions without master filter](https://github.com/kuskoman/logstash-exporter/actions?query=workflow%3A%22Go+application+CI%2FCD%22),
select the workflow run you want to download artifact from, and download the binary from the `Artifacts` section.
#### Docker Image
The Docker image is available under `kuskoman/logstash-exporter:`.
You can pull the image using the following command:
docker pull kuskoman/logstash-exporter:
You can browse tags on the [Docker Hub](https://hub.docker.com/r/kuskoman/logstash-exporter/tags).
The Docker image can be run using the following command:
docker run -d \
-p 9198:9198 \
-v $(pwd)/config.yml:/app/config.yml \
kuskoman/logstash-exporter:
##### Unstable (master) image
The unstable version of the Docker image can be downloaded from the
[GitHub Container Registry](https://github.com/users/kuskoman/packages/container/package/logstash-exporter).
To pull the image from command line simply use:
docker pull ghcr.io/kuskoman/logstash-exporter:master
The Docker image can be run using the following command:
docker run -d \
-p 9198:9198 \
-v $(pwd)/config.yml:/app/config.yml \
ghcr.io/kuskoman/logstash-exporter:master
#### Helm Chart
The Helm chart provides a Kubernetes deployment for Logstash Exporter. For detailed instructions, see the [Helm Deployment Guide](./HELM-DEPLOY.md) which includes:
- Installation instructions
- Prometheus integration
- Multiple Logstash instances monitoring setup
- High availability configuration
- Security best practices
- Troubleshooting tips
The chart's parameters are documented in its [README](./chart/README.md).
### Endpoints
- `/metrics`: Exposes metrics in Prometheus format.
- `/healthcheck`: Returns 200 if app runs properly and the connection with all logstash instanses is established.
- `/version`: Gives the information about the logstash-exporter build in json format.
- `/*`: Returns a 302 redirect to `/metrics`.
### Configuration
The application is now configured using a YAML file instead of environment variables. An example configuration is as follows:
**Important:** The `servers` section got renamed to `instances`. The `servers` section is no longer supported.
```yaml
logstash:
instances:
- url: "http://logstash:9600" # URL to Logstash API
name: "local_logstash" # Custom name for the Logstash instance (optional)
- url: "https://logstash2:9600"
name: "prod_logstash" # Custom name for the Logstash instance
tls_config: # TLS configuration for HTTPS connections
ca_file: "/path/to/ca.pem" # Path to custom CA certificate
server_name: "logstash.internal" # Override hostname for verification
insecure_skip_verify: false # Skip certificate verification (not recommended)
timeout: 2s # HTTP timeout for Logstash API requests
server:
host: "0.0.0.0" # Host on which the application will be exposed (default: all interfaces)
port: 9198 # Port on which the application will be exposed
tls_server_config: # TLS configuration for the exporter server
cert_file: "/path/to/cert.pem" # Path to TLS certificate
key_file: "/path/to/key.pem" # Path to TLS key
logging:
level: "debug" # Log level (debug, info, warn, error)
format: "text" # Log format (text, json)
```
All configuration variables can be checked in the [config directory](./config/).
Previously the application was configured using environment variables. The old configuration is no longer supported,
however a [migration script](./scripts/migrate_env_to_yaml.sh) is provided to migrate the old configuration to the new one.
See more in the [Migration](#migration) section.
## Migration
### From v1 to v2
#### With Migration Script
1. Backup Configuration: Save your existing .env file.
2. Run Migration Script: Execute ./scripts/migrate_v1_to_v2.sh [path/to/.env]. If your .env is in the default location,
simply run ./scripts/migrate_v1_to_v2.sh.
You can use it via make: `make migrate-v1-to-v2`.
3. Save New Configuration: Redirect output to new_config.yaml using ./scripts/migrate_v1_to_v2.sh.sh > config.yaml.
4. Set `EXPORTER_CONFIG_LOCATION`: Update this environment variable to the path of config.yaml (or leave the default).
5. Test Application: Ensure the application runs correctly with the new configuration.
#### Without Migration Script
1. Backup Configuration: Keep a record of your current environment variables.
2. Create YAML File: Manually create a config.yaml file following the new format.
3. Transfer Settings: Copy values from your .env file or noted environment variables into the corresponding sections in new_config.yaml.
4. Set EXPORTER_CONFIG_LOCATION: Point this environment variable to new_config.yaml.
5. Test Application: Check if the application functions properly with the new configuration.
## Building
### Makefile
#### Available Commands
- `make all`: Builds binary executables for all OS (Win, Darwin, Linux).
- `make run`: Runs the Go Exporter application.
- `make run-controller`: Runs the Go Controller application.
- `make run-and-watch-config`: Runs the Go Exporter application with watching the configuration file.
- `make build-linux`: Builds exporter and controller binaries for Linux.
- `make build-darwin`: Builds exporter and controller binaries for Darwin.
- `make build-windows`: Builds exporter and controller binaries for Windows.
- `make build-linux-arm`: Builds exporter and controller binaries for Linux ARM.
- `make build-docker`: Builds a Docker image for the Go Exporter application.
- `make build-docker-controller`: Builds a Docker image for the Kubernetes Controller.
- `make build-docker-all`: Builds both exporter and controller Docker images.
- `make build-docker-multi`: Builds a multi-arch Docker image (`amd64` and `arm64`) for the exporter.
- `make build-docker-controller-multi`: Builds a multi-arch Docker image (`amd64` and `arm64`) for the controller.
- `make clean`: Deletes all binary executables in the out directory.
- `make test`: Runs all unit tests (excludes e2e tests).
- `make test-coverage`: Displays test coverage report (excludes e2e tests).
- `make e2e-prepare`: Builds binary for e2e tests.
- `make e2e-run`: Runs e2e tests (requires e2e-prepare first).
- `make e2e`: Prepares and runs e2e tests.
- `make e2e-clean`: Cleans e2e test artifacts.
- `make compose`: Starts a Docker-compose configuration.
- `make wait-for-compose`: Starts a Docker-compose configuration until it's ready.
- `make compose-down`: Stops a Docker-compose configuration.
- `make verify-metrics`: Verifies the metrics from the Go Exporter application.
- `make pull`: Pulls the Docker image from the registry.
- `make logs`: Shows logs from the Docker-compose configuration.
- `make minify`: Minifies the binary executables.
- `make install-helm-readme`: Installs readme-generator-for-helm tool.
- `make helm-readme`: Generates Helm chart README.md file.
- `make helm-test`: Run Helm unit tests.
- `make clean-elasticsearch`: Cleans Elasticsearch data. The command may take a very long time to complete.
- `make clean-prometheus`: Cleans Prometheus data.
- `make upgrade-dependencies`: Upgrades all dependencies.
- `make migrate-v1-to-v2`: Migrates configuration from v1 to v2.
- `make update-readme-descriptions`: Update Makefile descriptions in main README.md.
- `make update-snapshots`: Updates snapshot for test data and runs unit tests (excludes e2e tests).
- `make help`: Shows info about available commands.
#### File Structure
The main Go Exporter application is located in the cmd/exporter/main.go file.
The binary executables are saved in the out directory.
## Helper Scripts
Application repository contains some helper scripts, which can be used to improve process
of building, testing, and running the application. These scripts are not useful for the end user,
but they can be useful for all potential contributors.
The helper scripts are located in the [scripts](./scripts/) directory.
### add_metrics_to_readme.sh
This [script](./scripts/add_metrics_to_readme.sh) is used to add metrics table to the README.md file.
Usage:
./scripts/add_metrics_to_readme.sh
### create_release_notes.sh
This [script](./scripts/create_release_notes.sh) is used to create release notes for the GitHub release.
Used primarily by the [CI workflow](./.github/workflows/go-application.yml).
### generate_helm_readme.sh
This [script](./scripts/generate_helm_readme.sh) is used to generate Helm chart [README.md](./chart/README.md) file.
The readme contains all the configuration variables from the [values.yaml](./chart/values.yaml) file.
### install_helm_readme_generator.sh
This [script](./scripts/install_helm_readme_generator.sh) is used to install
[readme-generator-for-helm](https://github.com/bitnami-labs/readme-generator-for-helm) tool.
The tool is used to generate Helm chart [README.md](./chart/README.md) file.
The script installs the tool under [helm-generator](./helm-generator) directory.
### verify_metrics.sh
This [script](./scripts/verify_metrics.sh) is used to verify the metrics from the Go Exporter application.
Can be used both locally and in the CI workflow.
./scripts/verify_metrics.sh
## Testing process
The application contains both unit and integration tests. All the tests are executed in the CI workflow.
### Unit Tests
Unit tests are located in the same directories as the tested files.
To run all unit tests, use the following command:
make test
### Integration Tests
Integration tests checks if Prometheus metrics are exposed properly.
To run them you must setup development [docker-compose](./docker-compose.yml) file.
make wait-for-compose
Then you can run the tests:
make verify-metrics
### Testing Standards
For consistency across the codebase, we follow a set of [Testing Standards](./TESTING-STANDARDS.md) that outlines:
- Test structure and naming conventions
- Error handling patterns
- Best practices for mocks and fixtures
- Guidelines for specific test types
Contributors should review these standards before submitting pull requests.
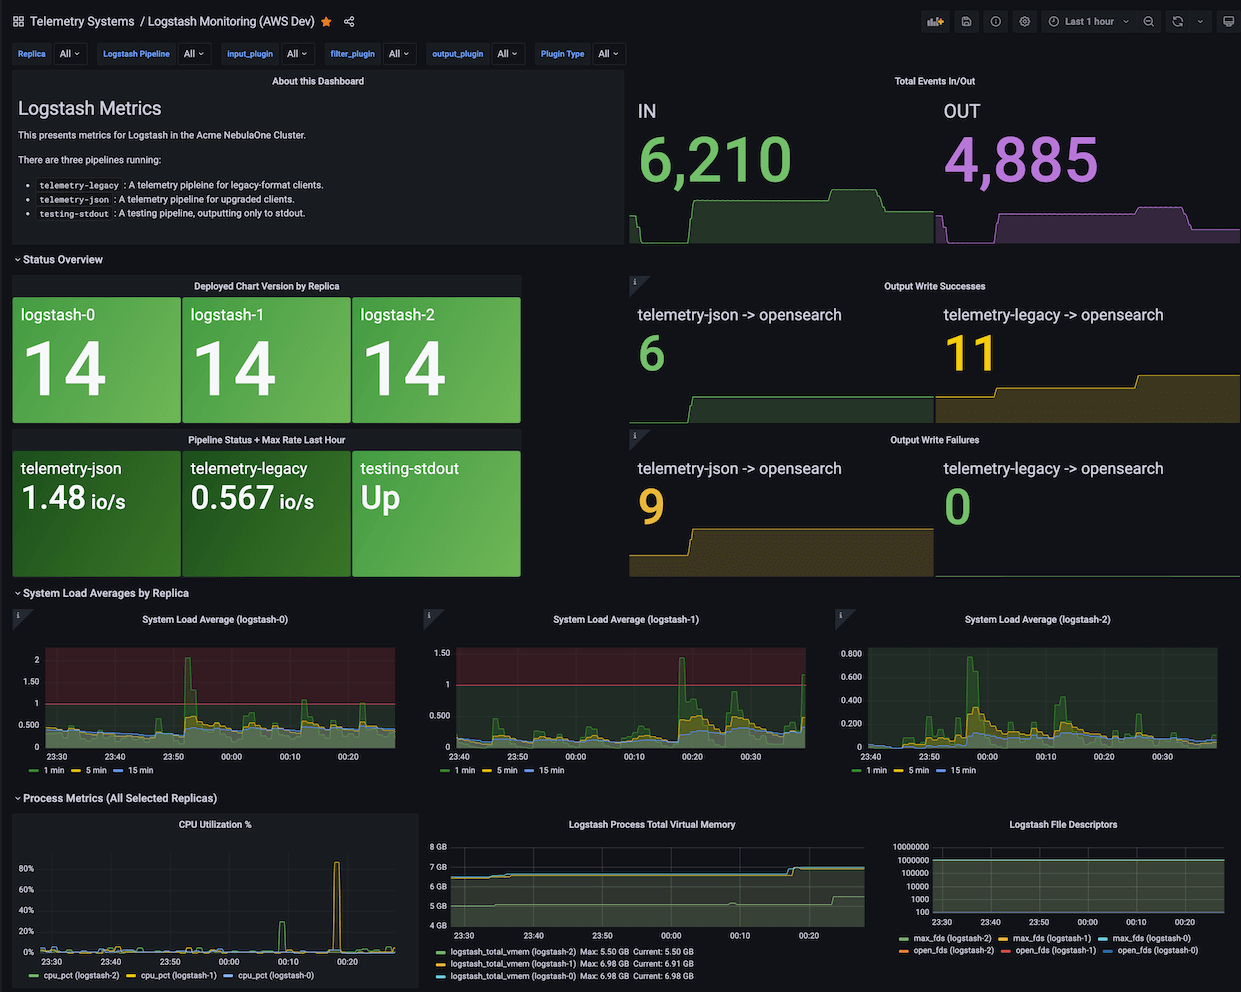
## Grafana Dashboard
A Grafana Dashboard designed for metrics from Logstash-exporter on Kubernetes is available at
[grafana.com/grafana/dashboards/18628-logstash-on-kubernetes-dashboard/](https://grafana.com/grafana/dashboards/18628-logstash-on-kubernetes-dashboard/).
This dashboard's JSON source is at [excalq/grafana-logstash-kubernetes](https://github.com/excalq/grafana-logstash-kubernetes).
(If not using Kubernetes, change `$pod` to `$instance` in the JSON.)
## Additional Information
This projects code was reviewed by [Boldly Go](https://www.youtube.com/@boldlygo)
in an awesome [video](https://www.youtube.com/watch?v=Oe6L5ZmqCDE), which in
a huge way helped me to improve the code quality.
## Contributing
If you want to contribute to this project, please read the [CONTRIBUTING.md](./CONTRIBUTING.md) file.
## Metrics
Table of exported metrics:
| Name | Type | Description |
| ----------- | ----------- | ----------- |
| logstash_exporter_build_info | gauge | A metric with a constant '1' value labeled by version, revision, branch, goversion from which logstash_exporter was built, and the goos and goarch for the build. |
| logstash_info_build | counter | A metric with a constant '1' value labeled by build date, sha, and snapshot of the logstash instance. |
| logstash_info_node | counter | A metric with a constant '1' value labeled by node name, version, host, http_address, and id of the logstash instance. |
| logstash_info_pipeline_batch_delay | gauge | Amount of time to wait for events to fill the batch before sending to the filter and output stages. |
| logstash_info_pipeline_batch_size | gauge | Number of events to retrieve from the input queue before sending to the filter and output stages. |
| logstash_info_pipeline_workers | gauge | Number of worker threads that will process pipeline events. |
| logstash_info_status | counter | A metric with a constant '1' value labeled by status. |
| logstash_info_up | gauge | A metric that returns 1 if the node is up, 0 otherwise. |
| logstash_stats_events_duration_millis | gauge | Duration of events processing in milliseconds. |
| logstash_stats_events_filtered | gauge | Number of events filtered out. |
| logstash_stats_events_in | gauge | Number of events received. |
| logstash_stats_events_out | gauge | Number of events out. |
| logstash_stats_events_queue_push_duration_millis | gauge | Duration of events push to queue in milliseconds. |
| logstash_stats_flow_filter_current | gauge | Current number of events in the filter queue. |
| logstash_stats_flow_filter_lifetime | gauge | Lifetime number of events in the filter queue. |
| logstash_stats_flow_input_current | gauge | Current number of events in the input queue. |
| logstash_stats_flow_input_lifetime | gauge | Lifetime number of events in the input queue. |
| logstash_stats_flow_output_current | gauge | Current number of events in the output queue. |
| logstash_stats_flow_output_lifetime | gauge | Lifetime number of events in the output queue. |
| logstash_stats_flow_queue_backpressure_current | gauge | Current number of events in the backpressure queue. |
| logstash_stats_flow_queue_backpressure_lifetime | gauge | Lifetime number of events in the backpressure queue. |
| logstash_stats_flow_worker_concurrency_current | gauge | Current number of workers. |
| logstash_stats_flow_worker_concurrency_lifetime | gauge | Lifetime number of workers. |
| logstash_stats_jvm_gc_collection_count | counter | Count of garbage collection runs for a given JVM memory pool. |
| logstash_stats_jvm_gc_collection_time_millis_total | counter | Total time spent running garbage collection for a given JVM memory pool. |
| logstash_stats_jvm_mem_heap_committed_bytes | gauge | Amount of heap memory in bytes that is committed for the Java virtual machine to use. |
| logstash_stats_jvm_mem_heap_max_bytes | gauge | Maximum amount of heap memory in bytes that can be used for memory management. |
| logstash_stats_jvm_mem_heap_used_bytes | gauge | Amount of used heap memory in bytes. |
| logstash_stats_jvm_mem_heap_used_percent | gauge | Percentage of the heap memory that is used. |
| logstash_stats_jvm_mem_non_heap_committed_bytes | gauge | Amount of non-heap memory in bytes that is committed for the Java virtual machine to use. |
| logstash_stats_jvm_mem_pool_committed_bytes | gauge | Amount of bytes that are committed for the Java virtual machine to use in a given JVM memory pool. |
| logstash_stats_jvm_mem_pool_max_bytes | gauge | Maximum amount of bytes that can be used in a given JVM memory pool. |
| logstash_stats_jvm_mem_pool_peak_max_bytes | gauge | Highest value of bytes that were used in a given JVM memory pool. |
| logstash_stats_jvm_mem_pool_peak_used_bytes | gauge | Peak used bytes of a given JVM memory pool. |
| logstash_stats_jvm_mem_pool_used_bytes | gauge | Currently used bytes of a given JVM memory pool. |
| logstash_stats_jvm_threads_count | gauge | Number of live threads including both daemon and non-daemon threads. |
| logstash_stats_jvm_threads_peak_count | gauge | Peak live thread count since the Java virtual machine started or peak was reset. |
| logstash_stats_jvm_uptime_millis | gauge | Uptime of the JVM in milliseconds. |
| logstash_stats_pipeline_dead_letter_queue_dropped_events | counter | Number of events dropped by the dead letter queue. |
| logstash_stats_pipeline_dead_letter_queue_expired_events | counter | Number of events expired in the dead letter queue. |
| logstash_stats_pipeline_dead_letter_queue_max_size_in_bytes | gauge | Maximum size of the dead letter queue in bytes. |
| logstash_stats_pipeline_dead_letter_queue_size_in_bytes | gauge | Current size of the dead letter queue in bytes. |
| logstash_stats_pipeline_events_duration | gauge | Time needed to process event. |
| logstash_stats_pipeline_events_filtered | counter | Number of events that have been filtered out by this pipeline. |
| logstash_stats_pipeline_events_in | counter | Number of events that have been inputted into this pipeline. |
| logstash_stats_pipeline_events_out | counter | Number of events that have been processed by this pipeline. |
| logstash_stats_pipeline_events_queue_push_duration | gauge | Time needed to push event to queue. |
| logstash_stats_pipeline_flow_filter_current | gauge | Current number of events in the filter queue. |
| logstash_stats_pipeline_flow_filter_lifetime | gauge | Lifetime number of events in the filter queue. |
| logstash_stats_pipeline_flow_input_current | gauge | Current number of events in the input queue. |
| logstash_stats_pipeline_flow_input_lifetime | gauge | Lifetime number of events in the input queue. |
| logstash_stats_pipeline_flow_output_current | gauge | Current number of events in the output queue. |
| logstash_stats_pipeline_flow_output_lifetime | gauge | Lifetime number of events in the output queue. |
| logstash_stats_pipeline_flow_queue_backpressure_current | gauge | Current number of events in the backpressure queue. |
| logstash_stats_pipeline_flow_queue_backpressure_lifetime | gauge | Lifetime number of events in the backpressure queue. |
| logstash_stats_pipeline_flow_worker_concurrency_current | gauge | Current number of workers. |
| logstash_stats_pipeline_flow_worker_concurrency_lifetime | gauge | Lifetime number of workers. |
| logstash_stats_pipeline_flow_worker_utilization_current | gauge | Current worker utilization. |
| logstash_stats_pipeline_flow_worker_utilization_lifetime | gauge | Lifetime worker utilization. |
| logstash_stats_pipeline_plugin_bulk_requests_errors | counter | Number of bulk request errors. |
| logstash_stats_pipeline_plugin_bulk_requests_responses | counter | Bulk request HTTP response counts by code. |
| logstash_stats_pipeline_plugin_documents_non_retryable_failures | counter | Number of output events with non-retryable failures. |
| logstash_stats_pipeline_plugin_documents_successes | counter | Number of successful bulk requests. |
| logstash_stats_pipeline_plugin_events_duration | counter | Time spent processing events in this plugin. |
| logstash_stats_pipeline_plugin_events_in | counter | Number of events received this pipeline. |
| logstash_stats_pipeline_plugin_events_out | counter | Number of events output by this pipeline. |
| logstash_stats_pipeline_plugin_events_queue_push_duration | gauge | Time spent pushing events into the input queue. |
| logstash_stats_pipeline_queue_events_count | counter | Number of events in the queue. |
| logstash_stats_pipeline_queue_events_queue_size | gauge | Number of events that the queue can accommodate |
| logstash_stats_pipeline_queue_max_size_in_bytes | gauge | Maximum size of given queue in bytes. |
| logstash_stats_pipeline_reloads_failures | counter | Number of failed pipeline reloads. |
| logstash_stats_pipeline_reloads_last_failure_timestamp | gauge | Timestamp of last failed pipeline reload. |
| logstash_stats_pipeline_reloads_last_success_timestamp | gauge | Timestamp of last successful pipeline reload. |
| logstash_stats_pipeline_reloads_successes | counter | Number of successful pipeline reloads. |
| logstash_stats_pipeline_up | gauge | Whether the pipeline is up or not. |
| logstash_stats_process_cpu_load_average_1m | gauge | Total 1m system load average. |
| logstash_stats_process_cpu_load_average_5m | gauge | Total 5m system load average. |
| logstash_stats_process_cpu_load_average_15m | gauge | Total 15m system load average. |
| logstash_stats_process_cpu_percent | gauge | CPU usage of the process. |
| logstash_stats_process_cpu_total_millis | counter | Total CPU time used by the process. |
| logstash_stats_process_max_file_descriptors | gauge | Limit of open file descriptors. |
| logstash_stats_process_mem_total_virtual | gauge | Total virtual memory used by the process. |
| logstash_stats_process_open_file_descriptors | gauge | Number of currently open file descriptors. |
| logstash_stats_queue_events_count | gauge | Number of events in the queue. |
| logstash_stats_reload_failures | counter | Number of failed reloads. |
| logstash_stats_reload_successes | counter | Number of successful reloads. |