Ecosyste.ms: Awesome
An open API service indexing awesome lists of open source software.
https://github.com/kyouheicf/cloudflare-graphql-grafana
Cloudflare R2 の GraphQL Analytics を Grafana で可視化する - Qiita
https://github.com/kyouheicf/cloudflare-graphql-grafana
cloudflare grafana graphql
Last synced: 26 days ago
JSON representation
Cloudflare R2 の GraphQL Analytics を Grafana で可視化する - Qiita
- Host: GitHub
- URL: https://github.com/kyouheicf/cloudflare-graphql-grafana
- Owner: kyouheicf
- Created: 2023-02-16T12:16:57.000Z (almost 2 years ago)
- Default Branch: main
- Last Pushed: 2023-02-24T16:46:21.000Z (almost 2 years ago)
- Last Synced: 2024-11-14T01:32:20.931Z (3 months ago)
- Topics: cloudflare, grafana, graphql
- Homepage: https://qiita.com/khayama/items/305bbf005b99b8ab4d39
- Size: 61.5 KB
- Stars: 6
- Watchers: 1
- Forks: 0
- Open Issues: 1
-
Metadata Files:
- Readme: README.md
Awesome Lists containing this project
README
# cloudflare-graphql-grafana
1. Prepare your Grafana environment
- Create free Grafana Cloud account
- [Grafana Pricing | Free, Pro, Advanced, Enterprise](https://grafana.com/pricing/?tab=free%EF%BC%89)
- or Use your own Grafana instance
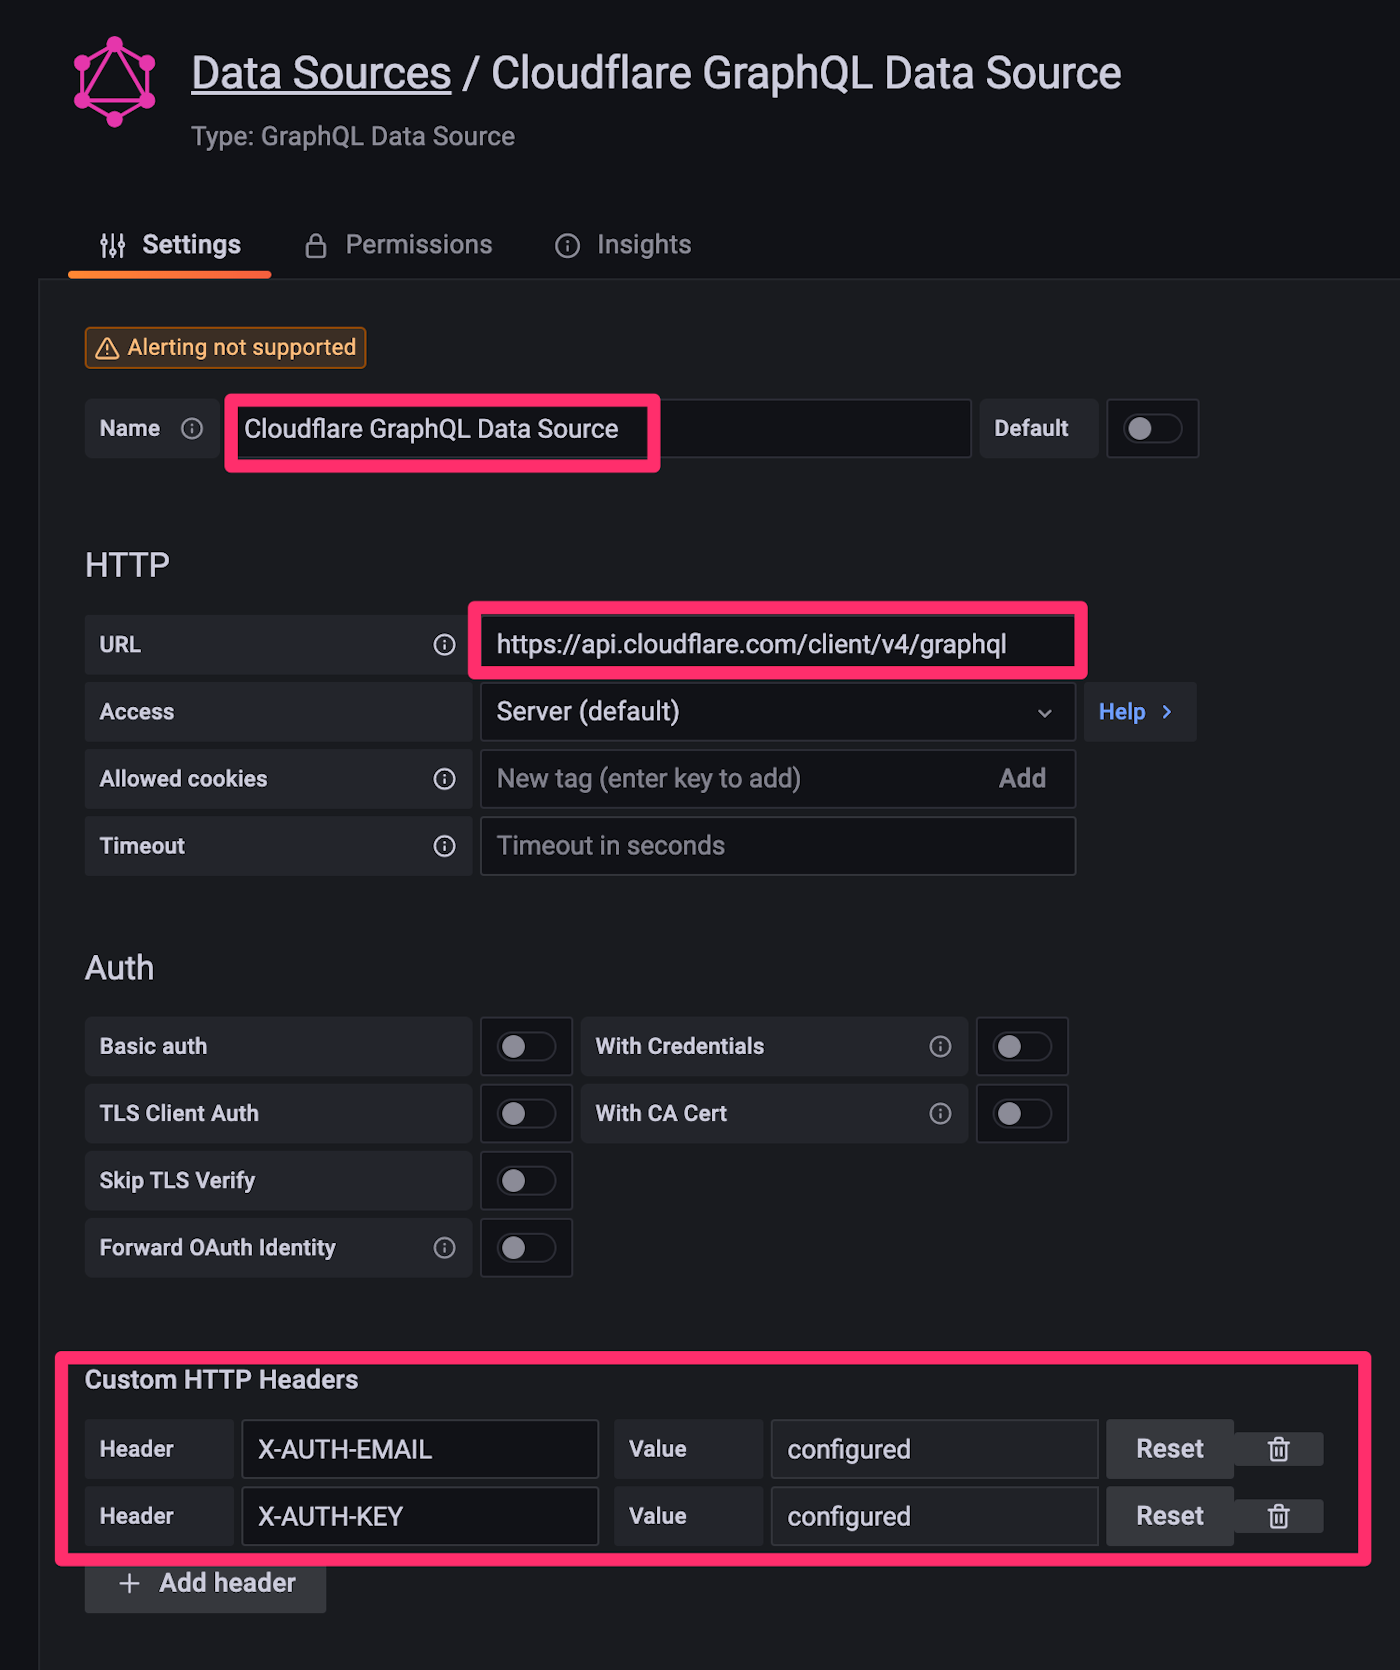
2. Install and Configure GraphQL Data Source plugin
- [GraphQL Data Source plugin for Grafana | Grafana Labs](https://grafana.com/grafana/plugins/fifemon-graphql-datasource/)
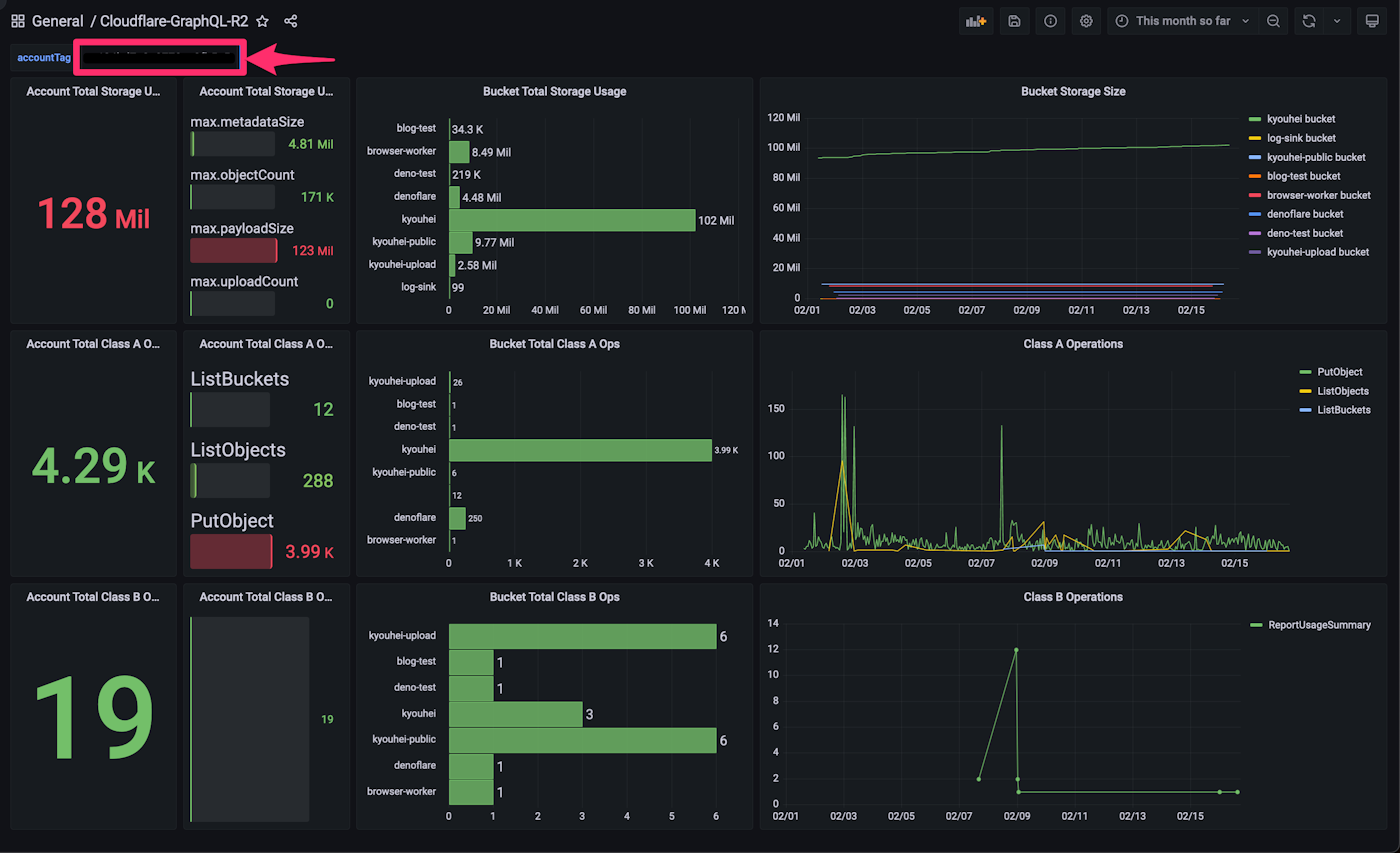
3. Import dashboard from JSON file
- Ref. [Manage dashboards | Grafana documentation](https://grafana.com/docs/grafana/latest/dashboards/manage-dashboards/#import-a-dashboard)
4. Enter your `accountTag` or `zoneTag` as Textbox variable on dashboard in order to show your account (or zone) specific analytics data
## Other Example
