https://github.com/la-niche/lick
A high level Line Integral Convolution (LIC) library for Python, including post-processing and visualization
https://github.com/la-niche/lick
fluid-dynamics line-integral-convolution magnetic-fields matplotlib post-processing python visualization
Last synced: 4 months ago
JSON representation
A high level Line Integral Convolution (LIC) library for Python, including post-processing and visualization
- Host: GitHub
- URL: https://github.com/la-niche/lick
- Owner: la-niche
- License: gpl-3.0
- Created: 2021-11-12T21:28:59.000Z (over 4 years ago)
- Default Branch: main
- Last Pushed: 2026-02-14T12:56:12.000Z (5 months ago)
- Last Synced: 2026-02-14T21:40:07.585Z (5 months ago)
- Topics: fluid-dynamics, line-integral-convolution, magnetic-fields, matplotlib, post-processing, python, visualization
- Language: Python
- Homepage:
- Size: 12.1 MB
- Stars: 5
- Watchers: 2
- Forks: 2
- Open Issues: 10
-
Metadata Files:
- Readme: README.md
- License: LICENSE
- Citation: CITATION.cff
Awesome Lists containing this project
README
# lick
[](https://pypi.org/project/lick/)
[](https://results.pre-commit.ci/latest/github/la-niche/lick/main)
[](https://github.com/charliermarsh/ruff)
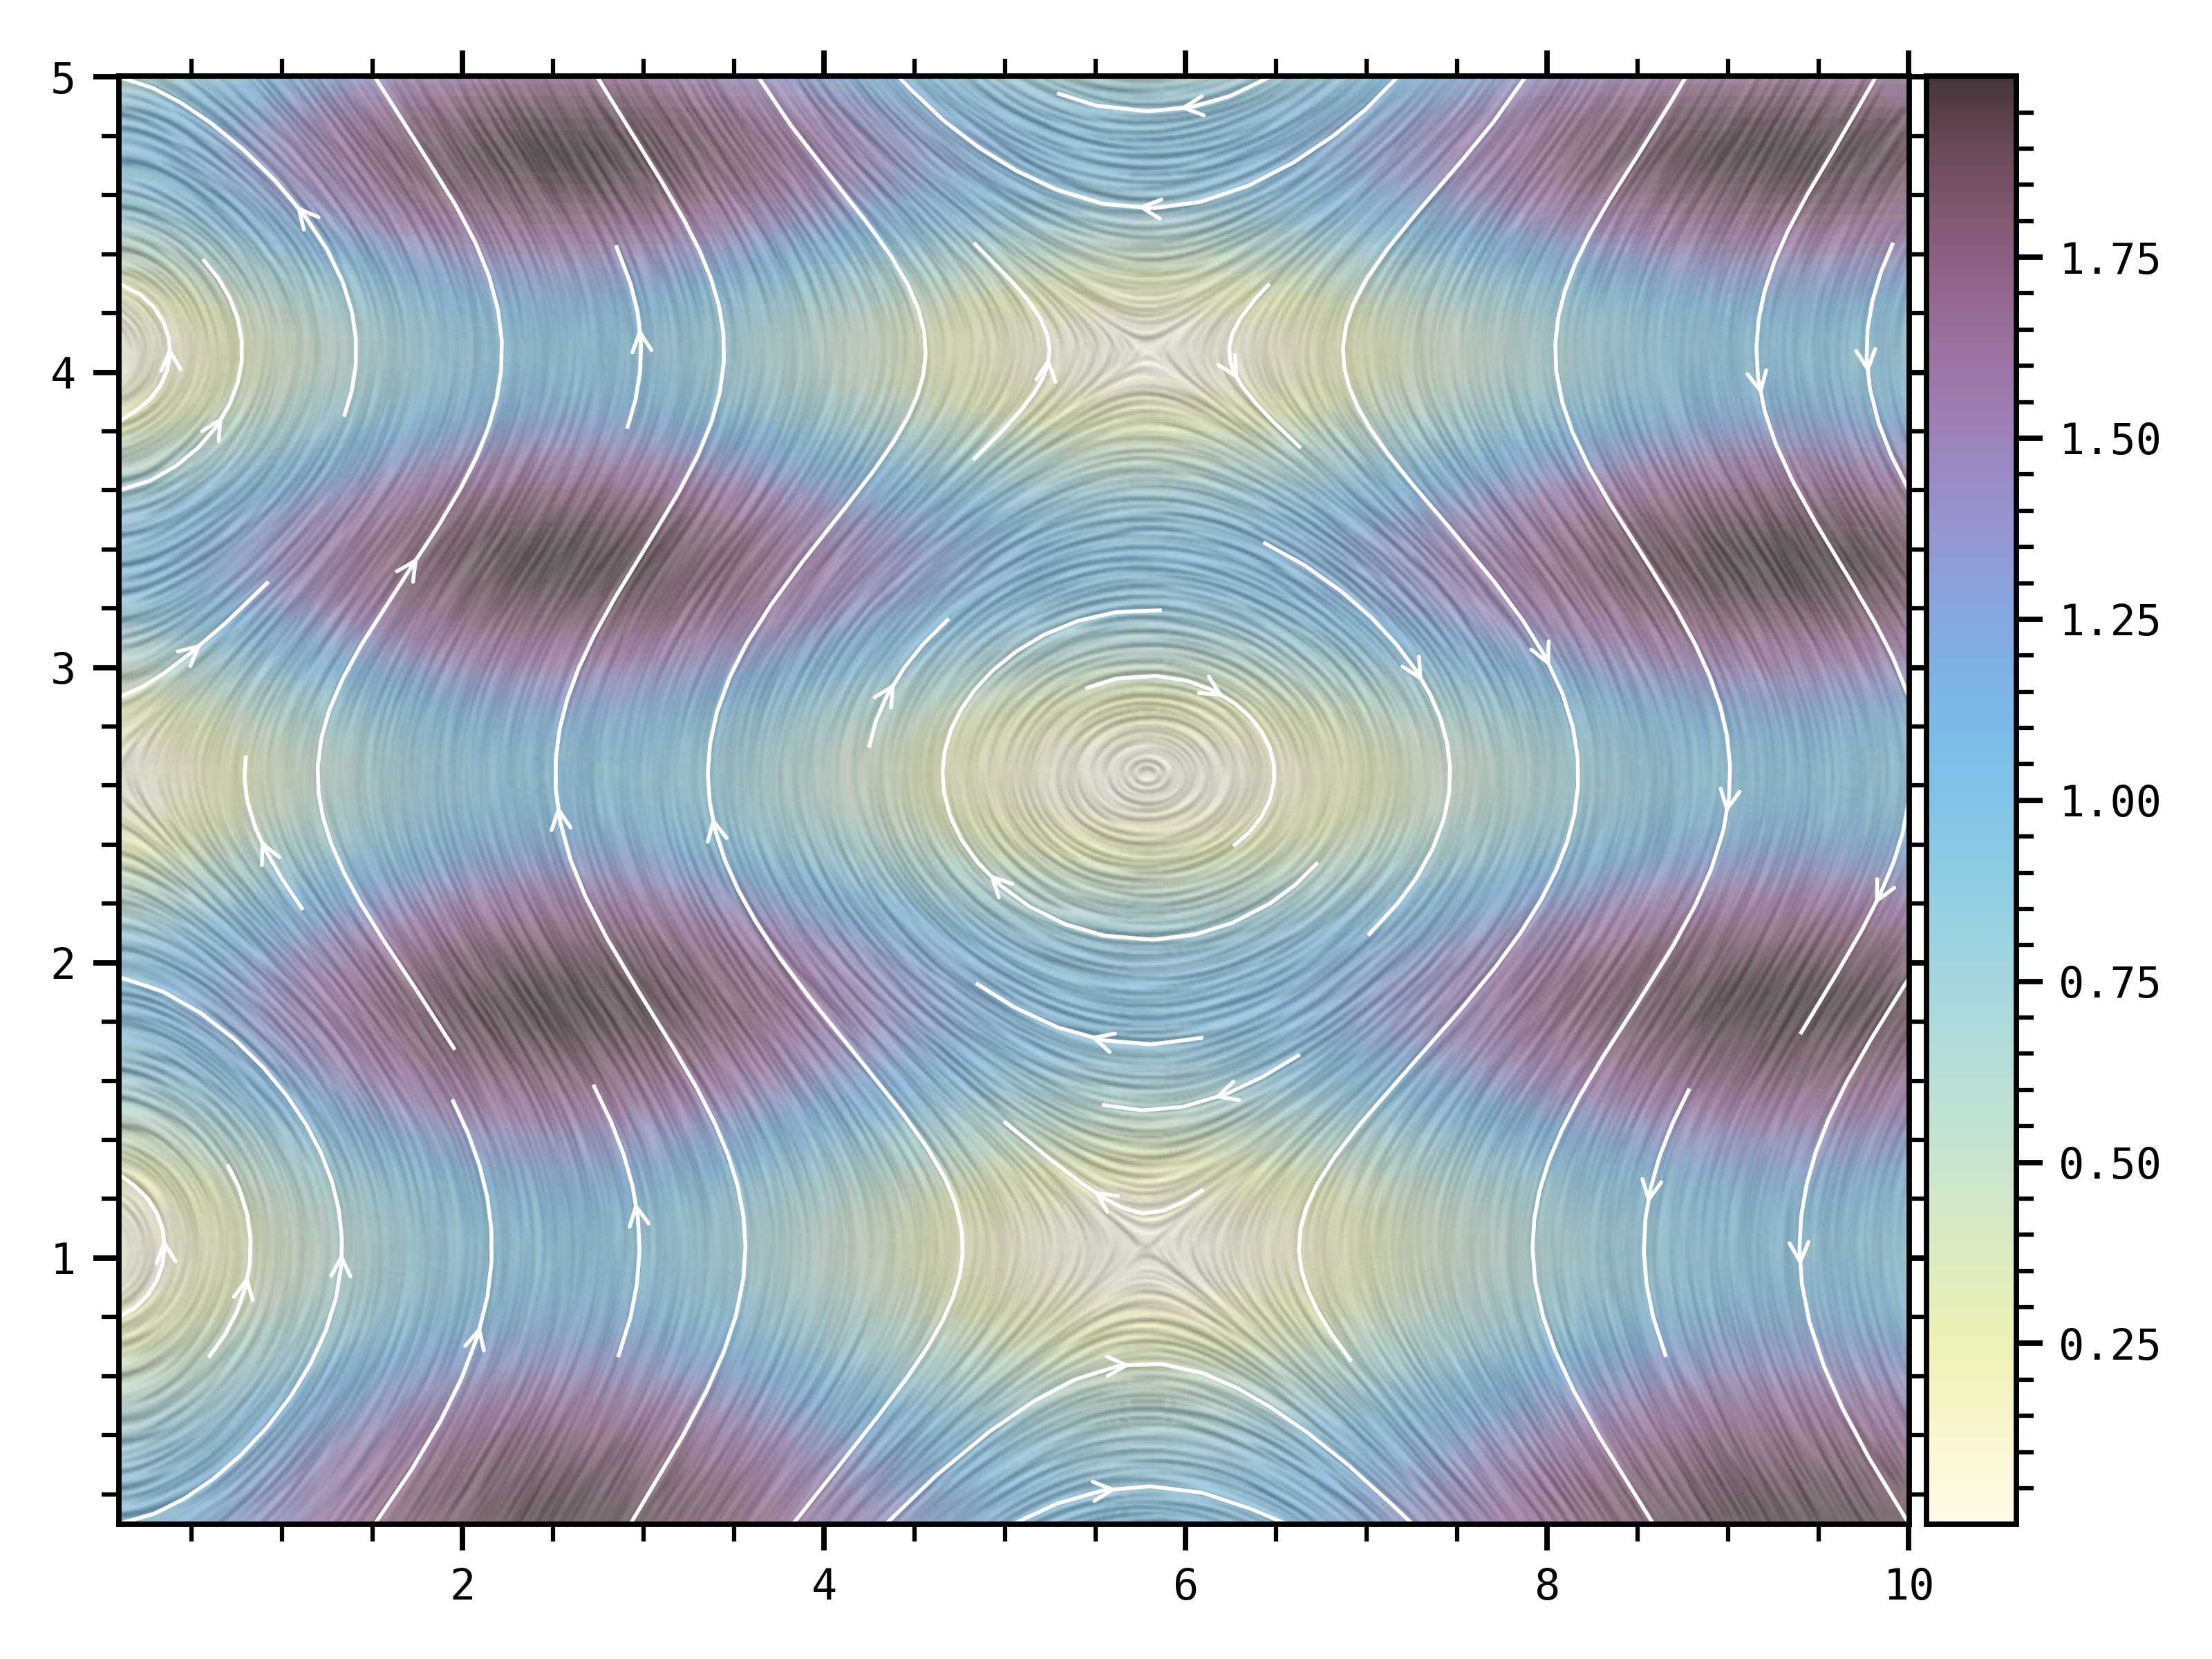
Line Integral Convolution Knit : clothe a 2D field (ex: density field) with a LIC texture,
given two vector fields (ex: velocity (vx, vy)).
This package builds on top of [rLIC](https://pypi.org/project/rlic), adding
post-processing and visualization functionalities.
Authors: Gaylor Wafflard-Fernandez, Clément Robert
Author-email: gaylor.wafflard@univ-grenoble-alpes.fr
## Installation
Install with `pip`
```
pip install lick
```
To import lick:
```python
import lick as lk
```
The important functions are `lick_box` and `lick_box_plot`. While `lick_box` interpolates the data and perform a line integral convolution, `lick_box_plot` directly plots the final image. Use `lick_box` if you want to have more control of the plots you want to do with the lic. Use `lick_box_plot` if you want to take advantage of the fine-tuning of the pcolormesh parameters.
## Example
```python
import numpy as np
import matplotlib.pyplot as plt
from lick import lick_box_plot
fig, ax = plt.subplots()
x = np.geomspace(0.1, 10, 128)
y = np.geomspace(0.1, 5, 128)
a, b = np.meshgrid(x, y)
v1 = np.cos(a)
v2 = np.sin(b)
field = v1 ** 2 + v2 ** 2
lick_box_plot(
fig,
ax,
x,
y,
v1,
v2,
field,
size_interpolated=256,
xmin=1,
xmax=9,
ymin=1,
ymax=4,
kernel=np.sin(np.linspace(0, np.pi, 64)),
niter_lic=5,
post_lic="north-west-light-source",
cmap="inferno",
stream_density=0.5,
)
plt.show()
```