https://github.com/laiti/ruuvistack
Ruuvi dashboard setup with Docker, Caddy, Mosquitto and Grafana
https://github.com/laiti/ruuvistack
caddy docker-compose grafana makefile mosquitto-mqtt-broker ruuvi-gateway ruuvitag
Last synced: 2 months ago
JSON representation
Ruuvi dashboard setup with Docker, Caddy, Mosquitto and Grafana
- Host: GitHub
- URL: https://github.com/laiti/ruuvistack
- Owner: laiti
- Created: 2025-02-16T14:05:44.000Z (over 1 year ago)
- Default Branch: main
- Last Pushed: 2025-02-20T17:39:54.000Z (over 1 year ago)
- Last Synced: 2025-02-20T18:39:17.159Z (over 1 year ago)
- Topics: caddy, docker-compose, grafana, makefile, mosquitto-mqtt-broker, ruuvi-gateway, ruuvitag
- Language: Makefile
- Homepage:
- Size: 396 KB
- Stars: 0
- Watchers: 1
- Forks: 0
- Open Issues: 0
-
Metadata Files:
- Readme: README.md
Awesome Lists containing this project
README
# Ruuvi-docker
Docker setup to set up a complete Ruuvitag monitoring stack with alerts. Aims to be highly configurable in a single place (.env file.)
## Components
- [Ruuvi Gateway](https://ruuvi.com/gateway/) - A dedicated device to route Ruuvitag data with MQTT.
- [Eclipse Mosquitto™](https://mosquitto.org/) - An open source MQTT broker.
- [Caddy](https://caddyserver.com/) - The Ultimate Server with Automatic HTTPS.
- [Grafana](https://grafana.com/) - The open and composable observability platform.
- [InfluxDB](https://www.influxdata.com/) - Platform for time series data.
- [RuuviBridge](https://github.com/Scrin/RuuviBridge) - A data bridge between Mosquitto and InfluxDB.
...and of course Docker and Docker-compose.
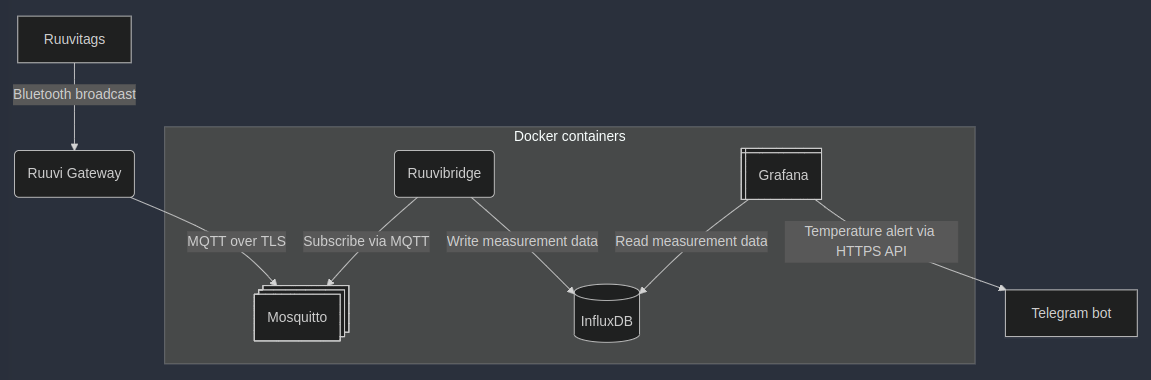
## Architecture
### As [Mermaid](https://mermaid.live/) graph
```
flowchart TD
A[Ruuvitags] -->|Bluetooth broadcast| B(Ruuvi Gateway)
B -->|MQTT over TLS| C@{ shape: processes, label: "Mosquitto" }
subgraph Docker containers
D(Ruuvibridge) -->|Subscribe via MQTT| C
D -->|Write measurement data| E@{ shape: cyl, label: "InfluxDB" }
F@{ shape: win-pane, label: "Grafana" } -->|Read measurement data| E
end
F -->|Temperature alert via HTTPS API| G@{shape: rect, label: "Telegram bot"}
```
## Setup guide
### In short
To bring the Docker containers up:
1) Populate `.env` file (example available at `examples/` dir)
2) Create Mosquitto certs with `make certs` and users with `make users`
3) Create Ruuvibridge config, InfluxDB2 client config and Mosquitto passwd file with `make config`
4) Run `docker-compose up` in the root directory.
NOTE: This launches Grafana in the public net with `admin/admin` default credentials to the hostname you set in `.env`. Be sure to change the password before anyone else does it. If they do not work, refer to the [grafana-oss docker image documentation](https://hub.docker.com/r/grafana/grafana-oss).
Besides that, there's some manual work to do.
### Mosquitto
#### Encryption
If you wish to encrypt your MQTT traffic (highly recommended in public internet), you need to generate certificates. And deliver the client certificate to Ruuvi Gateway. In short the command is `make config` but you might want to check the Makefile for details.
We possibly could use Caddy as well to encrypt the traffic but I am not sure how well that works with WebSockets.
#### Users
Mosquitto users and passwords are defined in `mosquitto/config/passwd`. Passwords are hashed. To create the file with required gateway and ruuvibridge users, simply command `make users`.
### InfluxDB
To use InfluxDB in, you need to create couple of things manually. This setup uses InfluxDB 2.
#### Connecting to InfluxDB
By default the InfluxDB is accessible only from Grafana and Ruuvibridge containers. Should you wish to run the InfluxDB command, you need to open the port. One way is to enable the `port:` statement from `compose.yaml` and restart container. You can create InfluxDB client config to your home directory (`~/.influxdbv2/configs`) with `make config`.
#### Create ruuvi bucket and config
The `-r 1825d` sets the retention period in days for the data. Adjust this according to your free disk space and how frequently Ruuvitags send the data. I use the longlife firmware version in my tags to extend battery life and save disk space.
```
. ./.env
influx config create --config-name ${INFLUXDB_BUCKET} --host-url http://localhost:8086 --token ${INFLUXDB_ADMIN_TOKEN} --active
influx bucket create -n ${INFLUXDB_BUCKET} --org-id ${INFLUXDB_ORGANIZATION} -r 1825d -t
```
#### Create grafana and ruuvibridge users:
```
. ./.env
influx user create -n ruuvibridge --org ${INFLUXDB_ORGANIZATION}
influx user password -n ruuvibridge
influx user create -n grafana --org ${INFLUXDB_ORGANIZATION}
influx user password -n grafana
influx auth create --org ${INFLUXDB_ORGANIZATION} --user grafana --read-authorizations --read-buckets
```
Configure ruuvibridge token to `ruuvibridge/config.yml` under the `influxdb_publisher`.
### Ruuvibridge
Ruuvibridge is configured with just `ruuvibridge/config.yml`, example config is in `examples/ruuvibridge.config.yml`. This setup uses the recommended **MQTT listener** mode. As the traffic between Mosquitto, Ruuvibridge and InfluxDB happens between Docker containers, no SSL is required. You can also create a template from variables in `.env` via `Makefile` with command `make config`
Change the `username` and `password` under `mqtt_listener` to the ones you created in Mosquitto. And configure your Ruuvitag BT addressess under `tag_names` and you should be good to go.
### Ruuvi Gateway settings
Enter the Ruuvi Gateway settings and proceed to page 7 (Cloud Options). Configure as below.
#### 7/11 Cloud Options ([screenshot](doc/ruuvi-gateway-settings-7-cloud-options.png))
- ✅ Use Ruuvi Cloud and/or a custom server and configure other advanced settings.
#### 8/11 Ruuvi Cloud ([screenshot](doc/ruuvi-gateway-settings-8-custom-server-mqtt.png))
- ✅ MQTT(S)
- ✅ MQTT over Secure WebSocket
- Server: wss://
- Port: 8886
- Data format
- ✅ Don't decode, send data in raw format (default)
- Username:
- Password:
- Topic prefix
- ✅ Use ‘ruuvi’ on the prefix
- ✅ Use Ruuvi Gateway's MAC address on the topic prefix
- 🟩 Use a custom topic prefix
- ✅ Use client SSL certificate (*.pem,*.crt,*.cert,*.key)
-
- ✅ Use custom SSL certificate for the server (*.pem,*.crt,*.cert)
-
### Grafana
Once you've set up Grafana, you can log in, configure InfluxDB as data source and start querying Ruuvitag data if all works. As stated above, the default login is `admin/admin`.
#### Example query for single tag with offset (usually handy with humidity measurements)
```
from(bucket: "ruuvi")
|> range(start: v.timeRangeStart, stop: v.timeRangeStop)
|> filter(fn: (r) => r._measurement == "ruuvi_measurements" and r._field == "humidity" and r.name == "Sauna")
|> map(fn: (r) => ({r with _value: float(v: r._value) - 5.75 }))
|> aggregateWindow(every: v.windowPeriod, fn: mean, createEmpty: true)
|> yield(name: "_time")
```
#### Example query for alert
```
from(bucket: "ruuvi")
|> range(start: -5m)
|> filter(fn: (r) => r._measurement == "ruuvi_measurements" and r._field == "temperature" and r.name == "Sauna")
```
Using the `r.name` requires that you've set up the `tag_names` in `ruuvibridge/config.yml` properly.
#### Alerts as Telegram messages
Grafana supports alert messages via Telegram out of the box. You can find [example alert template](examples/telegram-alert.template) in the `doc/` directory
## Sources
- https://github.com/mchestr/Secure-MQTT-Docker
- https://cedalo.com/blog/mqtt-tls-configuration-guide/
- https://docs.influxdata.com/influxdb/v2/install/use-docker-compose/
- https://medium.com/@tomer.klein/docker-compose-and-mosquitto-mqtt-simplifying-broker-deployment-7aaf469c07ee
- https://github.com/sukesh-ak/setup-mosquitto-with-docker/tree/main
- https://github.com/Scrin/RuuviBridge