https://github.com/laredoza/angularplotlycandlechart
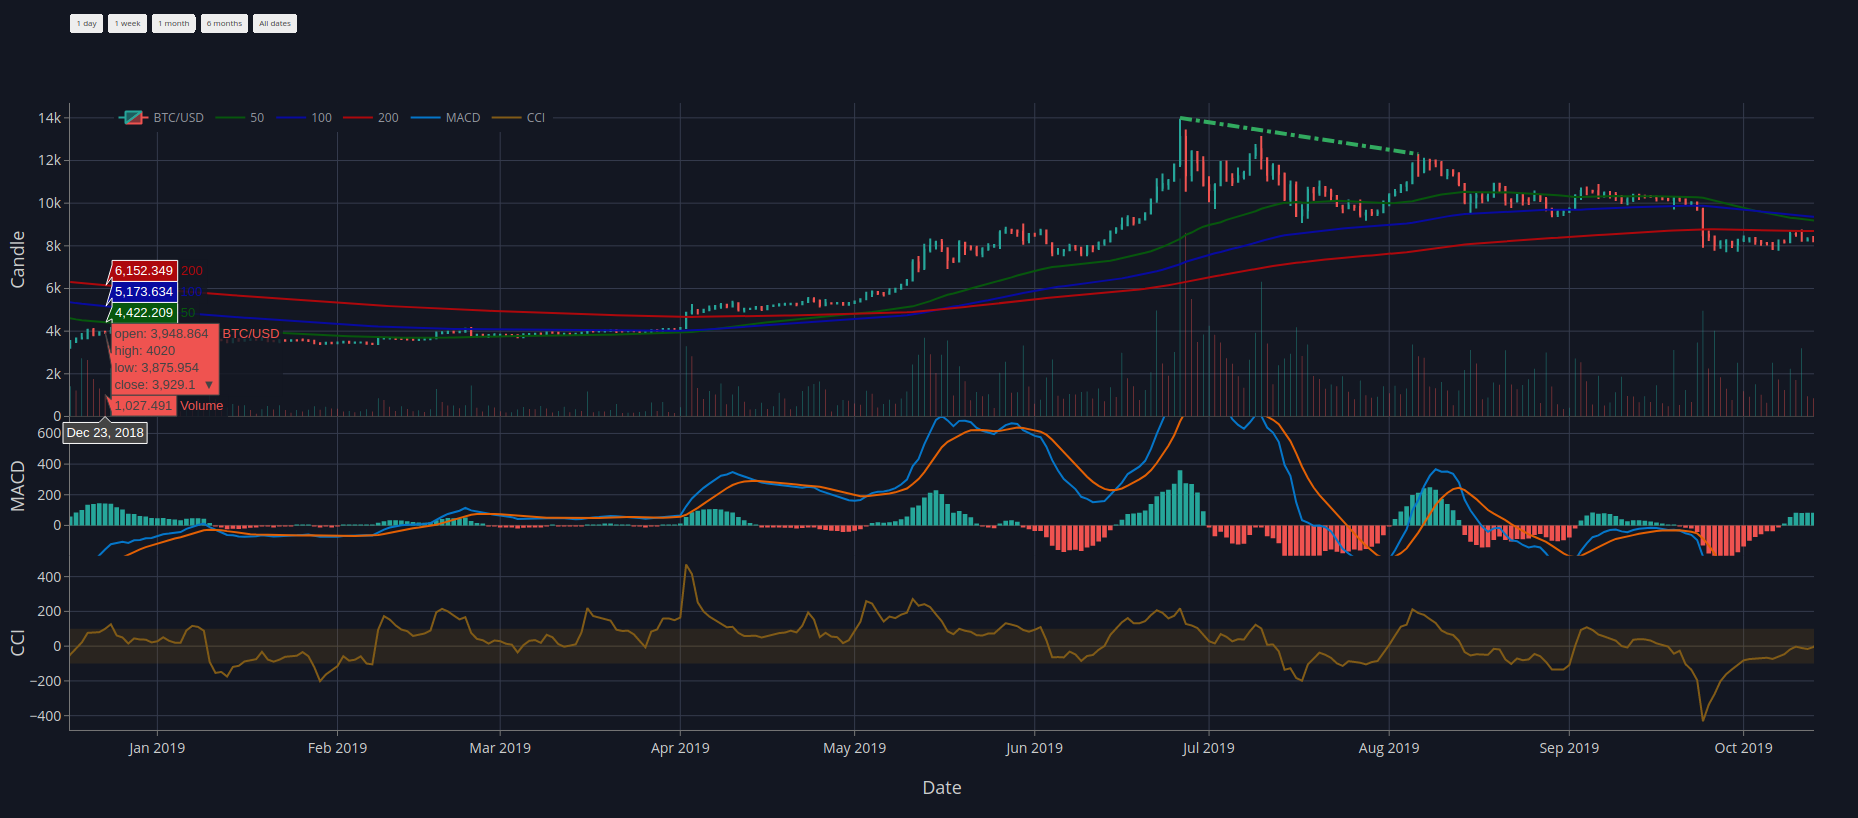
An example project to display Stock / Crypto candle chart ( Plotly ) with Angular 8. The chart gets it's data from Poloniex
https://github.com/laredoza/angularplotlycandlechart
angular-plotlyjs candle-chart cci macd plotlyjs poloniex technicalindicators
Last synced: 5 months ago
JSON representation
An example project to display Stock / Crypto candle chart ( Plotly ) with Angular 8. The chart gets it's data from Poloniex
- Host: GitHub
- URL: https://github.com/laredoza/angularplotlycandlechart
- Owner: laredoza
- License: mit
- Created: 2020-02-08T22:06:44.000Z (over 6 years ago)
- Default Branch: master
- Last Pushed: 2023-01-05T06:48:43.000Z (over 3 years ago)
- Last Synced: 2025-08-23T12:33:29.878Z (11 months ago)
- Topics: angular-plotlyjs, candle-chart, cci, macd, plotlyjs, poloniex, technicalindicators
- Language: TypeScript
- Homepage:
- Size: 2.29 MB
- Stars: 1
- Watchers: 1
- Forks: 2
- Open Issues: 23
-
Metadata Files:
- Readme: README.md
- License: LICENSE
Awesome Lists containing this project
README
# Angular Plotly Candle Chart
A sandbox project to display Stock / Crypto candle charts ( Plotly ) with Angular 8. Currently the chart displays a candle chart, MACD & CCI chart. The chart gets it's data from Poloniex
# Links
- [Angular Plotly](https://github.com/plotly/angular-plotly.js/blob/master/README.md)
- [Plotly](https://plot.ly/javascript/)
- [TechnicalIndicators](https://www.npmjs.com/package/technicalindicators)