https://github.com/lavolp3/MMM-AVStock
MagicMirror module for displaying stock price with yfinance API
https://github.com/lavolp3/MMM-AVStock
Last synced: 5 months ago
JSON representation
MagicMirror module for displaying stock price with yfinance API
- Host: GitHub
- URL: https://github.com/lavolp3/MMM-AVStock
- Owner: lavolp3
- License: mit
- Created: 2018-09-25T12:45:45.000Z (over 6 years ago)
- Default Branch: master
- Last Pushed: 2024-08-07T10:33:25.000Z (9 months ago)
- Last Synced: 2024-11-18T16:50:56.338Z (5 months ago)
- Language: JavaScript
- Homepage:
- Size: 566 KB
- Stars: 38
- Watchers: 5
- Forks: 18
- Open Issues: 4
-
Metadata Files:
- Readme: README.md
- License: LICENSE
Awesome Lists containing this project
- awesome-mmm - **MMM-AVStock**
README
# MMM-AVStock
MagicMirror module for displaying stock price using the Alphavantage API.
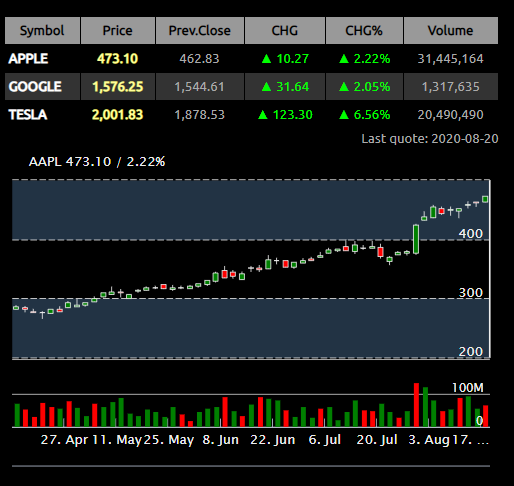
## Screenshot
- `mode:table`

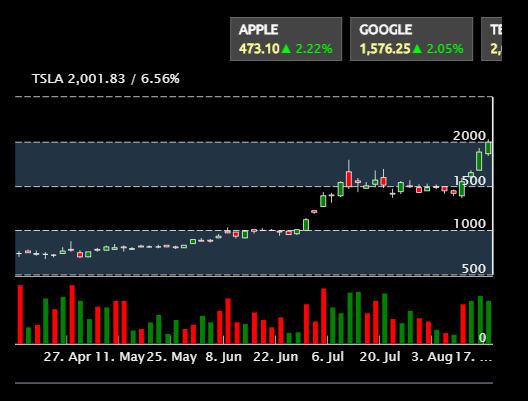
- `mode:ticker`

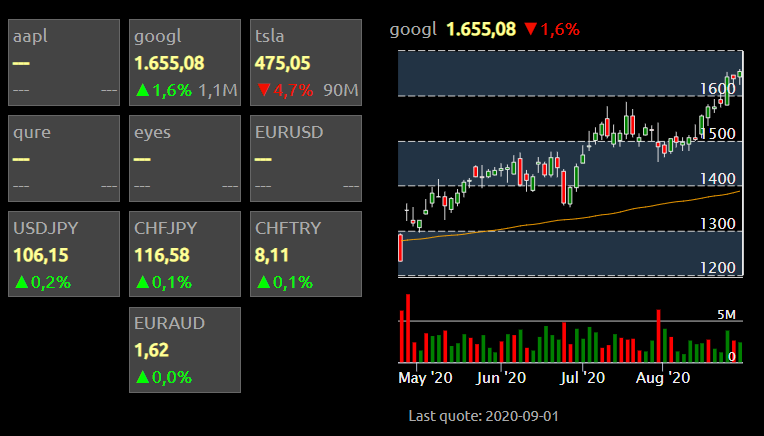
- `mode:grid` with `direction:'row'`

- `mode:ticker with own purchase prices`

- `mode:ticker with own purchase prices and total performance compared to the purchase price`

## UPDATES ##
** 4.0.0 **
- complete switch to yfinance, no alphavantage key necessary
- cosmetic changes,esp. to ticker
** 3.0.0 **
- included yfinance for quote data (no login necessary)
- kept alphavantage (via npm module) for tech and historical data
- new DOM creation methods, should be more flexible now.
- changed tableHeader and tableHeaderTitles config outlay
** 2.3.1 **
- included `pureLine` option to remove axes and gridlines
** 2.3.0 **
- multi-table support. Use config option `maxTableRows` to show several table pages when symbol count exceeds maxTableRows.
- improved `direction` description.
- added purchasePrice and perf2Purch to grid and table (thanks @spitzlbergerj)
- improved ticker and grid styling
** 2.2.0 **
- (by @spitzlbergerj) within the ticker mode, a line with the own purchase price and the display for profit and loss is added. The performance compared to the own purchase price can be displayed too.
- changed width scheme, hopefully fixing #35
- optimized tagline, now showing once below chart or table/grid/ticker
- code cleanup
- fixed ticker length (may fix ticker length issue): ticker can now expand over many items.
- optimized grid
** 2.1.0 **
- grid layout
- direction option to show chart besides other module
- improved styling
- fixed alias issue
** 2.0.0 **
- included Highcharts npm module for charts
- option to add chart (`mode: series` still available)
- improved API calls
- technicals (EMA or SMA)
- touch functions (choose stock chart, zoom in chart)
## Installation
```shell
cd ~/MagicMirror/modules
git clone https://github.com/lavolp3/MMM-AVStock
cd MMM-AVStock
npm install
```
## Key
No Key needed anymore! Yay!
## Configuration
### Simple
```javascript
{
//disabled:true,
module: "MMM-AVStock",
position: "top_left",
config: {
symbols : ["AAPL", "GOOGL", "TSLA"],
alias: ["APPLE", "GOOGLE", "TESLA"],
}
},
```
### Detailed
```javascript
{
module: "MMM-AVStock",
position: "top_left", //"bottom_bar" is better for `mode:ticker`
config: {
timeFormat: "DD-MM HH:mm",
width: null,
symbols : ["AAPL", "GOOGL", "TSLA"],
alias: ["APPLE", "GOOGLE", "TESLA"],
purchasePrice: [123.45, 1234.56, 12.34],
tickerDuration: 20,
chartDays: 90,
maxTableRows: null,
mode : "table", // "table" or "ticker"
showChart: true,
pureLine: false,
chartWidth: null,
showVolume: true,
chartInterval: "daily", // choose from ["intraday", "daily", "weekly", "monthly"]
decimals : 2,
chartType: 'line', // 'line', 'candlestick', or 'ohlc'
alternateGridColor: '#223344',
chartLineColor: '#eee',
chartLabelColor: '#eee',
coloredCandles: true,
showPurchasePrices: true,
showPerformance2Purchase: true,
debug: false
}
},
```
## Configuration Options
| **Option** | **Type** | **Default** | **Description** |
| --- | --- | --- | --- |
| `mode` | string | 'table' | Use 'table' for table mode, 'ticker' for ticker mode, or 'grid' for a grid mode. |
| `width` | integer | null | Width of every module element. Sets the distinctive width of table, ticker, chart, or grid. If you keep this unchanged, width will be set to 100%. Apart from '100%', please use integer values! |
| `classes` | string | 'small' | Set classes known from module classes (xsmall, small, bright, dimmed etc.) |
| `direction` | string | 'row' | You can set `row` or `column`. setting row will place chart next to the table/grid/ticker as long as there is enough space available. **Only works with `width` option set to a value** |
| `timeFormat` | string | 'DD-MM HH:mm' | Format of dates to be shown. Use moment.js format style here |
| `symbols` | array | ["AAPL", "GOOGL", "TSLA"] | Array of stock symbols |
| `alias` | array | [] | Array of aliases to replace the stock symbol. Leave all or each empty to show the symbol name. |
| `maxTableRows` | integer | null | Set maximum table rows to paginate table with more symbols than rows. |
| `purchasePrice` | array of numbers | [] | Array of own purchase prices |
| `showPurchasePrices` | boolean | false | Whether to show the own purchase prices. |
| `showPerformance2Purchase` | boolean | false | Whether to show the total performace compared to the own purchase prices. |
| `tickerDuration` | integer | 20 | Determines ticker speed |
| `chartDays` | integer | 90 | Number of days to show in the chart. (Max 90 days!) |
| `showChart` | boolean | true | Whether to show the chart. |
| `alternateGridColor` | string | '#223344' | Use 3- or 6-digit hex numbers as strings here. Change to something like '#000' if you want to have a completely black chart. |
| `pureLine` | boolean | false | Set `true` to remove axes and gridlines (and volume) to show a pure line (or candlesticks) |
| `chartWidth` | integer | null | Determines width of chart, separate from overall width above |
| `chartInterval` | string | 'daily' | Chart interval. Currently only daily supported! |
| `showVolume` | boolean | true | Show volume bars in the chart. |
| `movingAverage` | object | `{ type: "SMA", periods: [200]}` | movingAverages to include in the graph. Use `EMA` or `SMA` type and an array of all moving averages you want to see. Consider that every MA uses an own API call. |
| `decimals` | integer | | Number of decimals. |
| `chartType` | string | `line` | Use `line`, `candlestick`, or `ohlc` |
| `chartLineColor` | string | `#eee` | Color of line chart |
| `chartLabelColor` | string | `#eee` | Color of chart labels |
| `coloredCandles` | boolean | true | Whether to use colored candles or OHLC bars. |
| `debug` | boolean | false | Debug mode: additional output on server side (console) and client side (browser) |
## ToDo
[x] Use another API!
[x] Grid view
[x] Support purchase Price in all modes
[ ] Fix Volume bars (not showing correct colors due to highcharts' grouping function
[ ] Support technicals (EMA, SMA)