https://github.com/layerex/beizer-curves
A python library for generating beizer curves.
https://github.com/layerex/beizer-curves
beizer beizer-curves mouse-movement
Last synced: over 1 year ago
JSON representation
A python library for generating beizer curves.
- Host: GitHub
- URL: https://github.com/layerex/beizer-curves
- Owner: Layerex
- License: mpl-2.0
- Created: 2021-11-12T18:14:58.000Z (over 4 years ago)
- Default Branch: master
- Last Pushed: 2021-11-12T19:03:53.000Z (over 4 years ago)
- Last Synced: 2025-03-12T06:19:54.693Z (over 1 year ago)
- Topics: beizer, beizer-curves, mouse-movement
- Language: Python
- Homepage:
- Size: 10.7 KB
- Stars: 0
- Watchers: 1
- Forks: 0
- Open Issues: 0
-
Metadata Files:
- Readme: README.md
- License: LICENSE
Awesome Lists containing this project
README
          # beizer-curves

A python library for generating beizer curves.

## Installation

```sh

pip install beizer-curves

```

## Usage

```python

def beizer_curve(

    points,

    output_points_count: int,

    destructive: bool = False,

    dtype: np.dtype = np.int64,

):

```

Generate a beizer curve.

- `points` - Knots in format: `[[x1, x2, ..., xn], [y1, y2, ..., yn], [z1, z2, ..., zn]]`.

- `output_points_count` - How many points of the curve to generate.

- `destructive` - Allow function to modify `points` array. Don't set to true, if you want to use `points` array later.

- `dtype` - dtype of array of returned points of the curve.

Points of a curve are returned in format: `[[x1, x2, ..., xn], [y1, y2, ..., yn], [z1, z2, ..., zn]]`, where n is `output_points_count`.

```python

def random_beizer_curve(

    start_point,

    end_point,

    output_points_count: int,

    random_points_count: int = 1,

    point_spread: float = 1,

    noise_max_offset: float = 0,

    noise_rate: float = 0.5,

    dtype=np.int64,

    return_forming_points: bool = False,

):

```

Generate a random beizer curve, which starts at start_point and ends at end_point.

- `start_point`, `end_point` - coordinates of start and end points of curve in format `[x, y, z, ...]`.

- `output_points_count` - How many points of the curve to generate.

  ```python

  if output_points_count < 0:

       output_points_count = math.ceil(distance / -output_points_count)

  ```

  Where `distance` is distance between start and end.

- `random_points_count` - How many knots to generate.

- `point_spread` - A scale of a rectangular figure with corners of start_point and end_point, in bounds of which random knots are generated. Has to be > 0.

- `noise_max_offset` - Max offset of a curve point.

  ```python

  if output_points_count < 0:

      output_points_count = math.ceil(distance / -output_points_count)

  ```

  Where `distance` is distance between start and end.

- `noise_rate` - A part of curve points to apply noise offset to. Has to belong to [0; 1].

- `dtype` - dtype array of returned points of the curve.

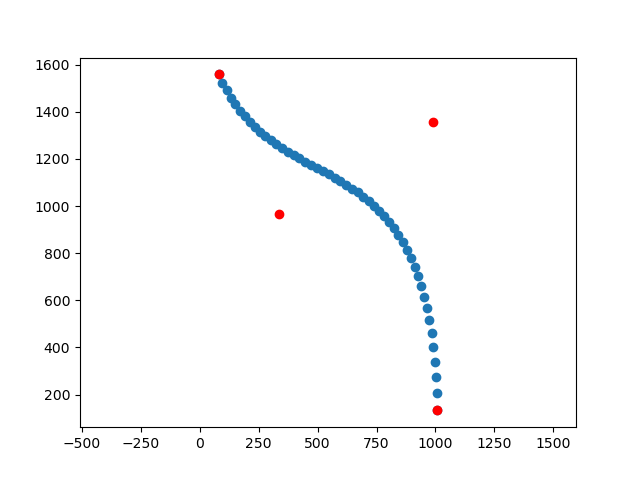
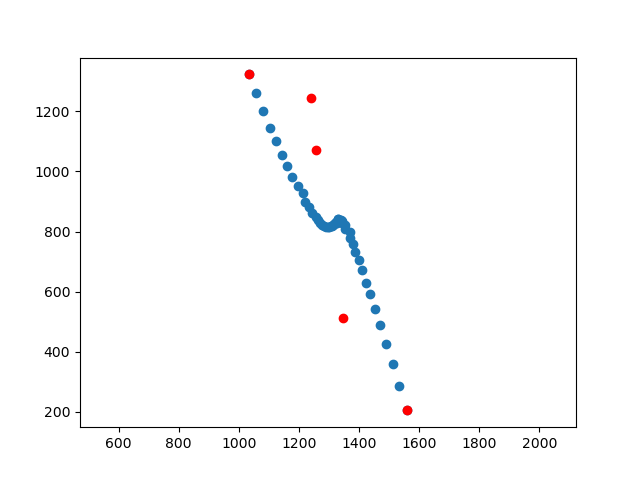
- `return_forming_points` - `return points, curve if return_forming_points else curve`, where `points` are randomly generated knots

## Usage example

```python

import random

import matplotlib.pyplot as plt

import numpy as np

from beizer_curves import *

def plot_curve(points_count, i):

    start = [random.randrange(1, 2000), random.randrange(1, 2000)]

    noise = -200 * i

    end = [random.randrange(1, 2000), random.randrange(1, 2000)]

    points, curve = random_beizer_curve(

        start,

        end,

        output_points_count=50,

        random_points_count=points_count,

        noise_max_offset=noise,

        noise_rate=0.25,

        dtype=np.float64,

        return_forming_points=True,

    )

    fig = plt.figure()

    plt.axis("equal")

    plt.scatter(curve[0], curve[1])

    plt.scatter(points[0], points[1], color='red')

    fig.savefig(f"example_{points_count}_{i + 1}.png")

```

## Example curves