https://github.com/liamarguedas/amazon-music-genres
Music Feature Clustering for Amazon's Music services
https://github.com/liamarguedas/amazon-music-genres
clustering data-science machine-learning
Last synced: 10 months ago
JSON representation
Music Feature Clustering for Amazon's Music services
- Host: GitHub
- URL: https://github.com/liamarguedas/amazon-music-genres
- Owner: liamarguedas
- License: mit
- Created: 2023-06-07T16:35:09.000Z (about 3 years ago)
- Default Branch: main
- Last Pushed: 2023-06-08T20:35:38.000Z (about 3 years ago)
- Last Synced: 2025-03-12T01:47:20.314Z (over 1 year ago)
- Topics: clustering, data-science, machine-learning
- Language: Jupyter Notebook
- Homepage:
- Size: 14.2 MB
- Stars: 1
- Watchers: 1
- Forks: 0
- Open Issues: 0
-
Metadata Files:
- Readme: README.md
- License: LICENSE
Awesome Lists containing this project
README
# Amazon Music Genres Clustering
## Problem description
Every person has a different taste in music. We cannot identify what kind of music does a person likes by just knowing about their lifestyle, hobbies, or profession. So it is difficult for music streaming applications to recommend music to a person. But if we know what kind of songs a person listens to daily, we can find similarities in all the music files and recommend similar music to the person.
That is where the cluster analysis of music genres comes in. Here we have a dataset of popular songs on Amazon Music, which contains artists and music names with all audio characteristics of each music.
## Decision Making process
Before I started implementing algorithms and running clusters in the data I wanted to really understand the data I was working with, so I did an ordinary exploratory data analysis to find some correlations.
Some feature have very high correlations as seen in the following chart:
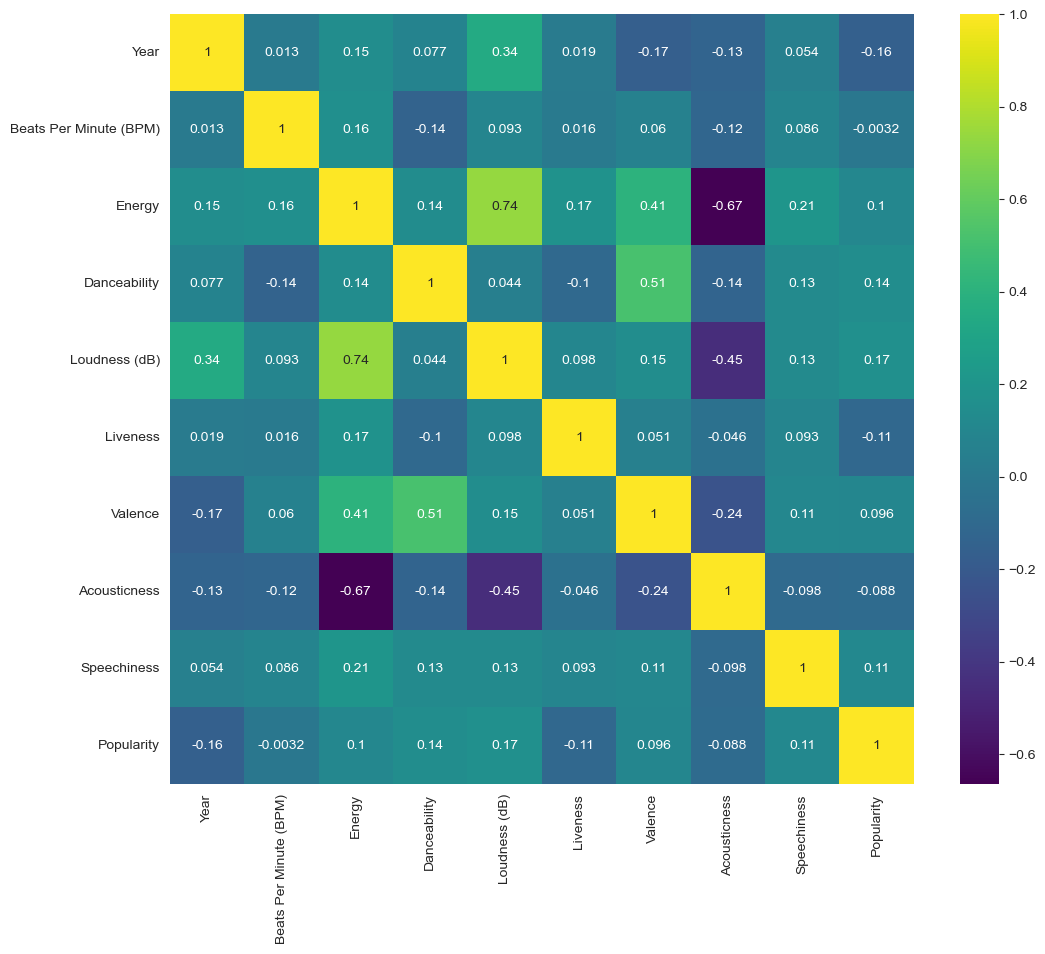
I found some high correlations that I went and explore even more in plots.
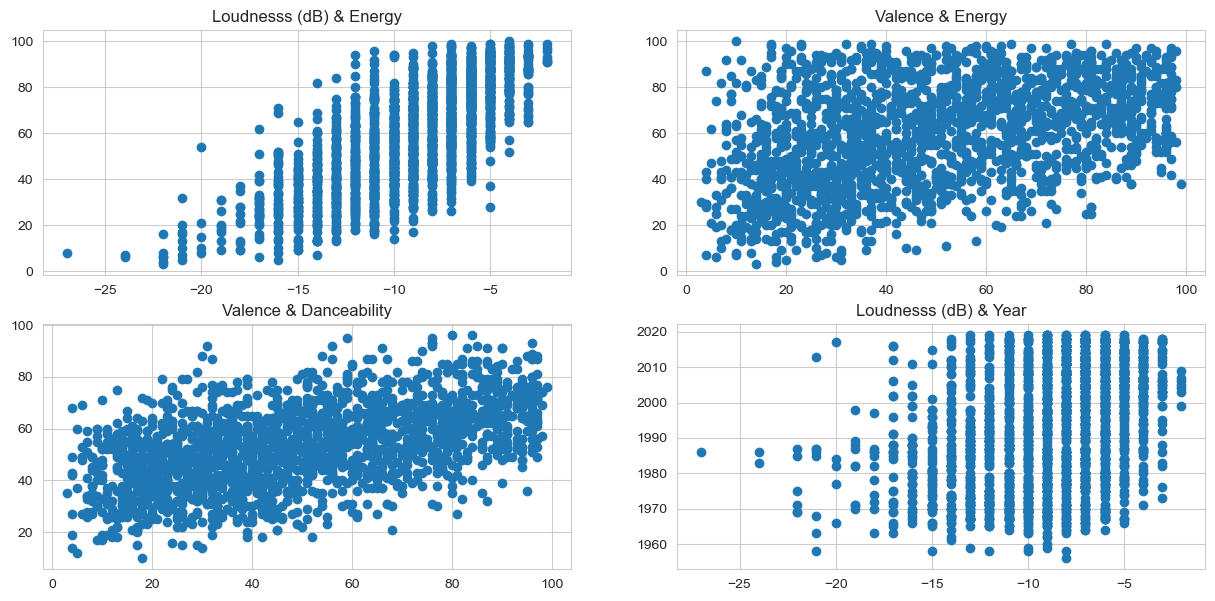
It was noticeable a linear relationship between the correlated features, this is important because it really tells us that music characteristics have patterns that can be clustered.
After the exploratory data analysis I started the preprocessing of the data to run the algorithms. In order to understand the range of clusters I needed to try in the models I ran an Elbow Method by ploting the inertia that looked like:
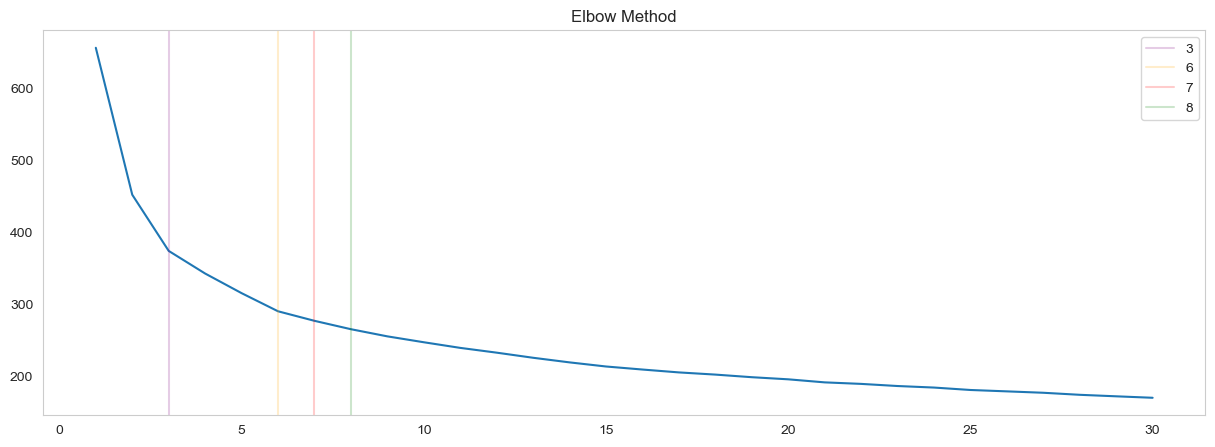
Since the data is not 2-Dimensional neither 3-Dimensional theres is no clean cut off point, but from the EAD I knew that I needed to model at least 3 clusters in the data. So I decided to try 3, 6, 7 and 8 clusters.
For the algorithms there is a lot of options, I decided to train:
- K-Means Clustering
- Mean-Shift Clustering
- Density-Based Spatial Clustering of Applications with Noise (DBSCAN)
- Agglomerative Hierarchical Clustering
Together with a MinMaxScaler (Because of the data distribution)
## Final Decision
After training all the models with the K-Means algorithm, I got amazing results with 3 clusters and surprisingly 10 clusters really did an outstanding job (I was not taking into consideration 10 clusters, but 8 clusters were trained I felt like I needed I couple of more clusters for a perfect fit).
With 3 clusters I mananged to get the following results (For the plotly charts please go to the [Notebook](https://github.com/liamarguedas/data/blob/main/Data-Science/Amazon-Music-Genres/Amazon-Music-Genres.ipynb) and run it locally):
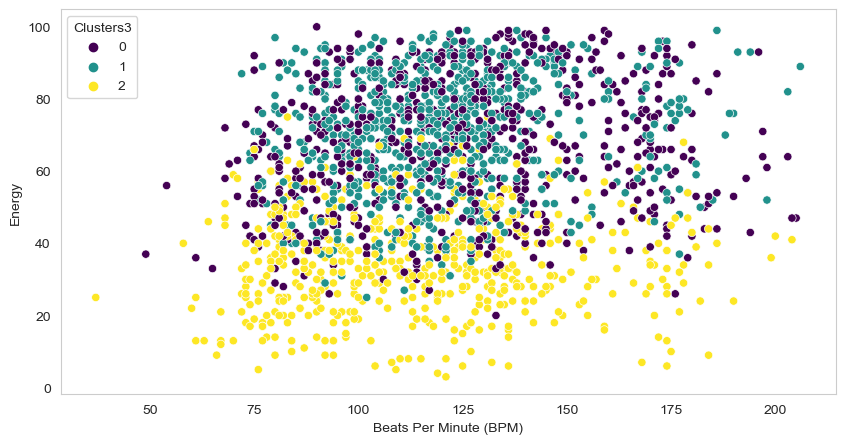
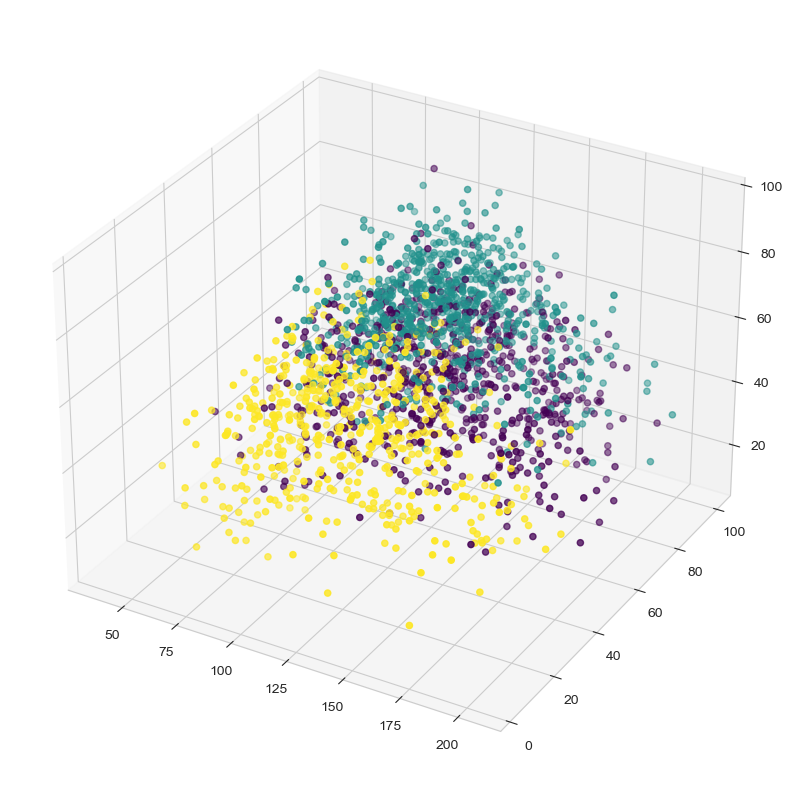
As you can see some really good clusters but can 3 clusters really describe what kind of music people like? Unfortunately no, 3 clusters can not describe it. I knew I needed more clusters than 3. After trying 3, 6, 7, 8 and 10 I realised that 10 could really solve the problem. So I decided to use 10 clusters to end the project.
With 10 clusters I managed to get the next results:
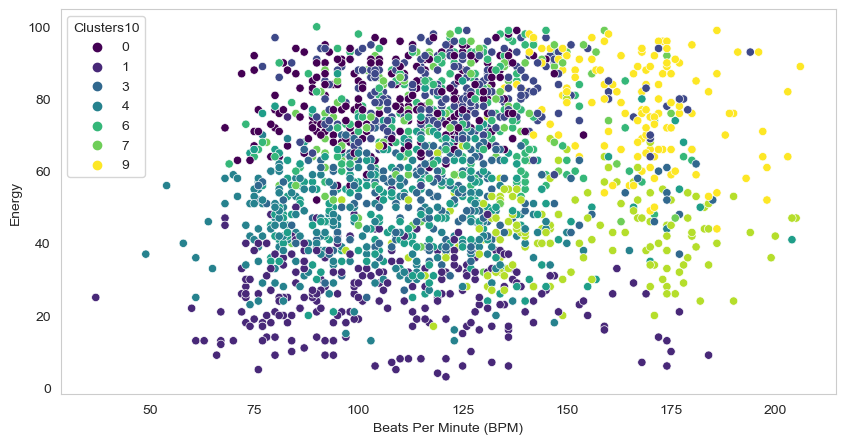
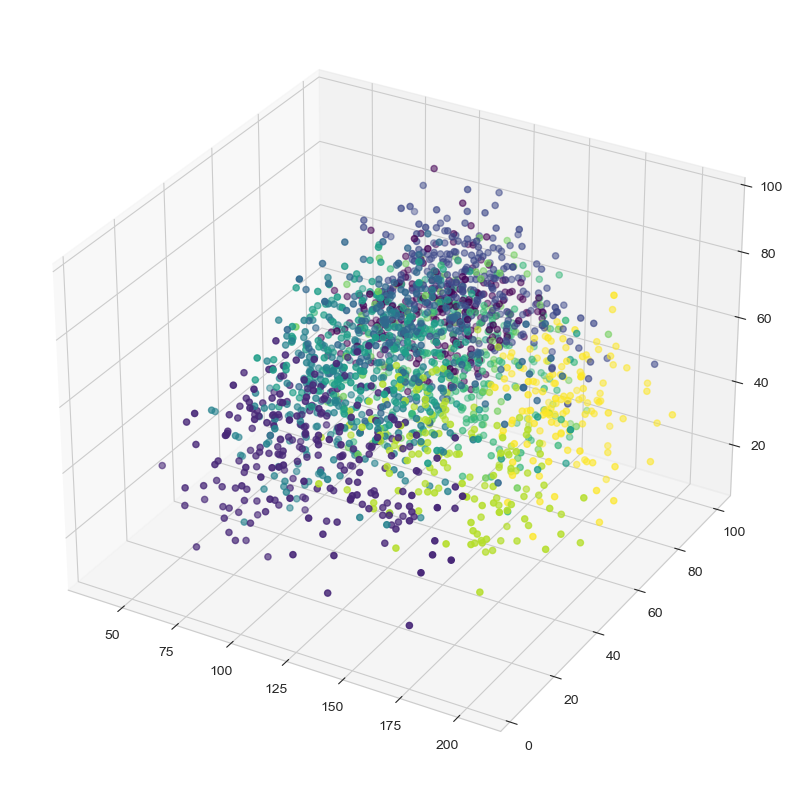
Since I got really good results with 10 clusters using K-Means I decided to train the final model with this algorithm too. The cluster statistics in the data looked like:
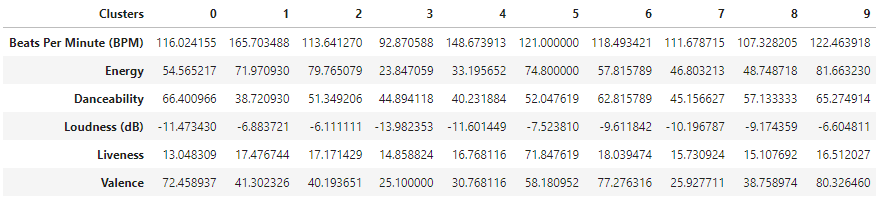
I also wanted to see the clusters in the entire dataset to, so I plot each feature and use the clusters as a Hue. It showed the next results
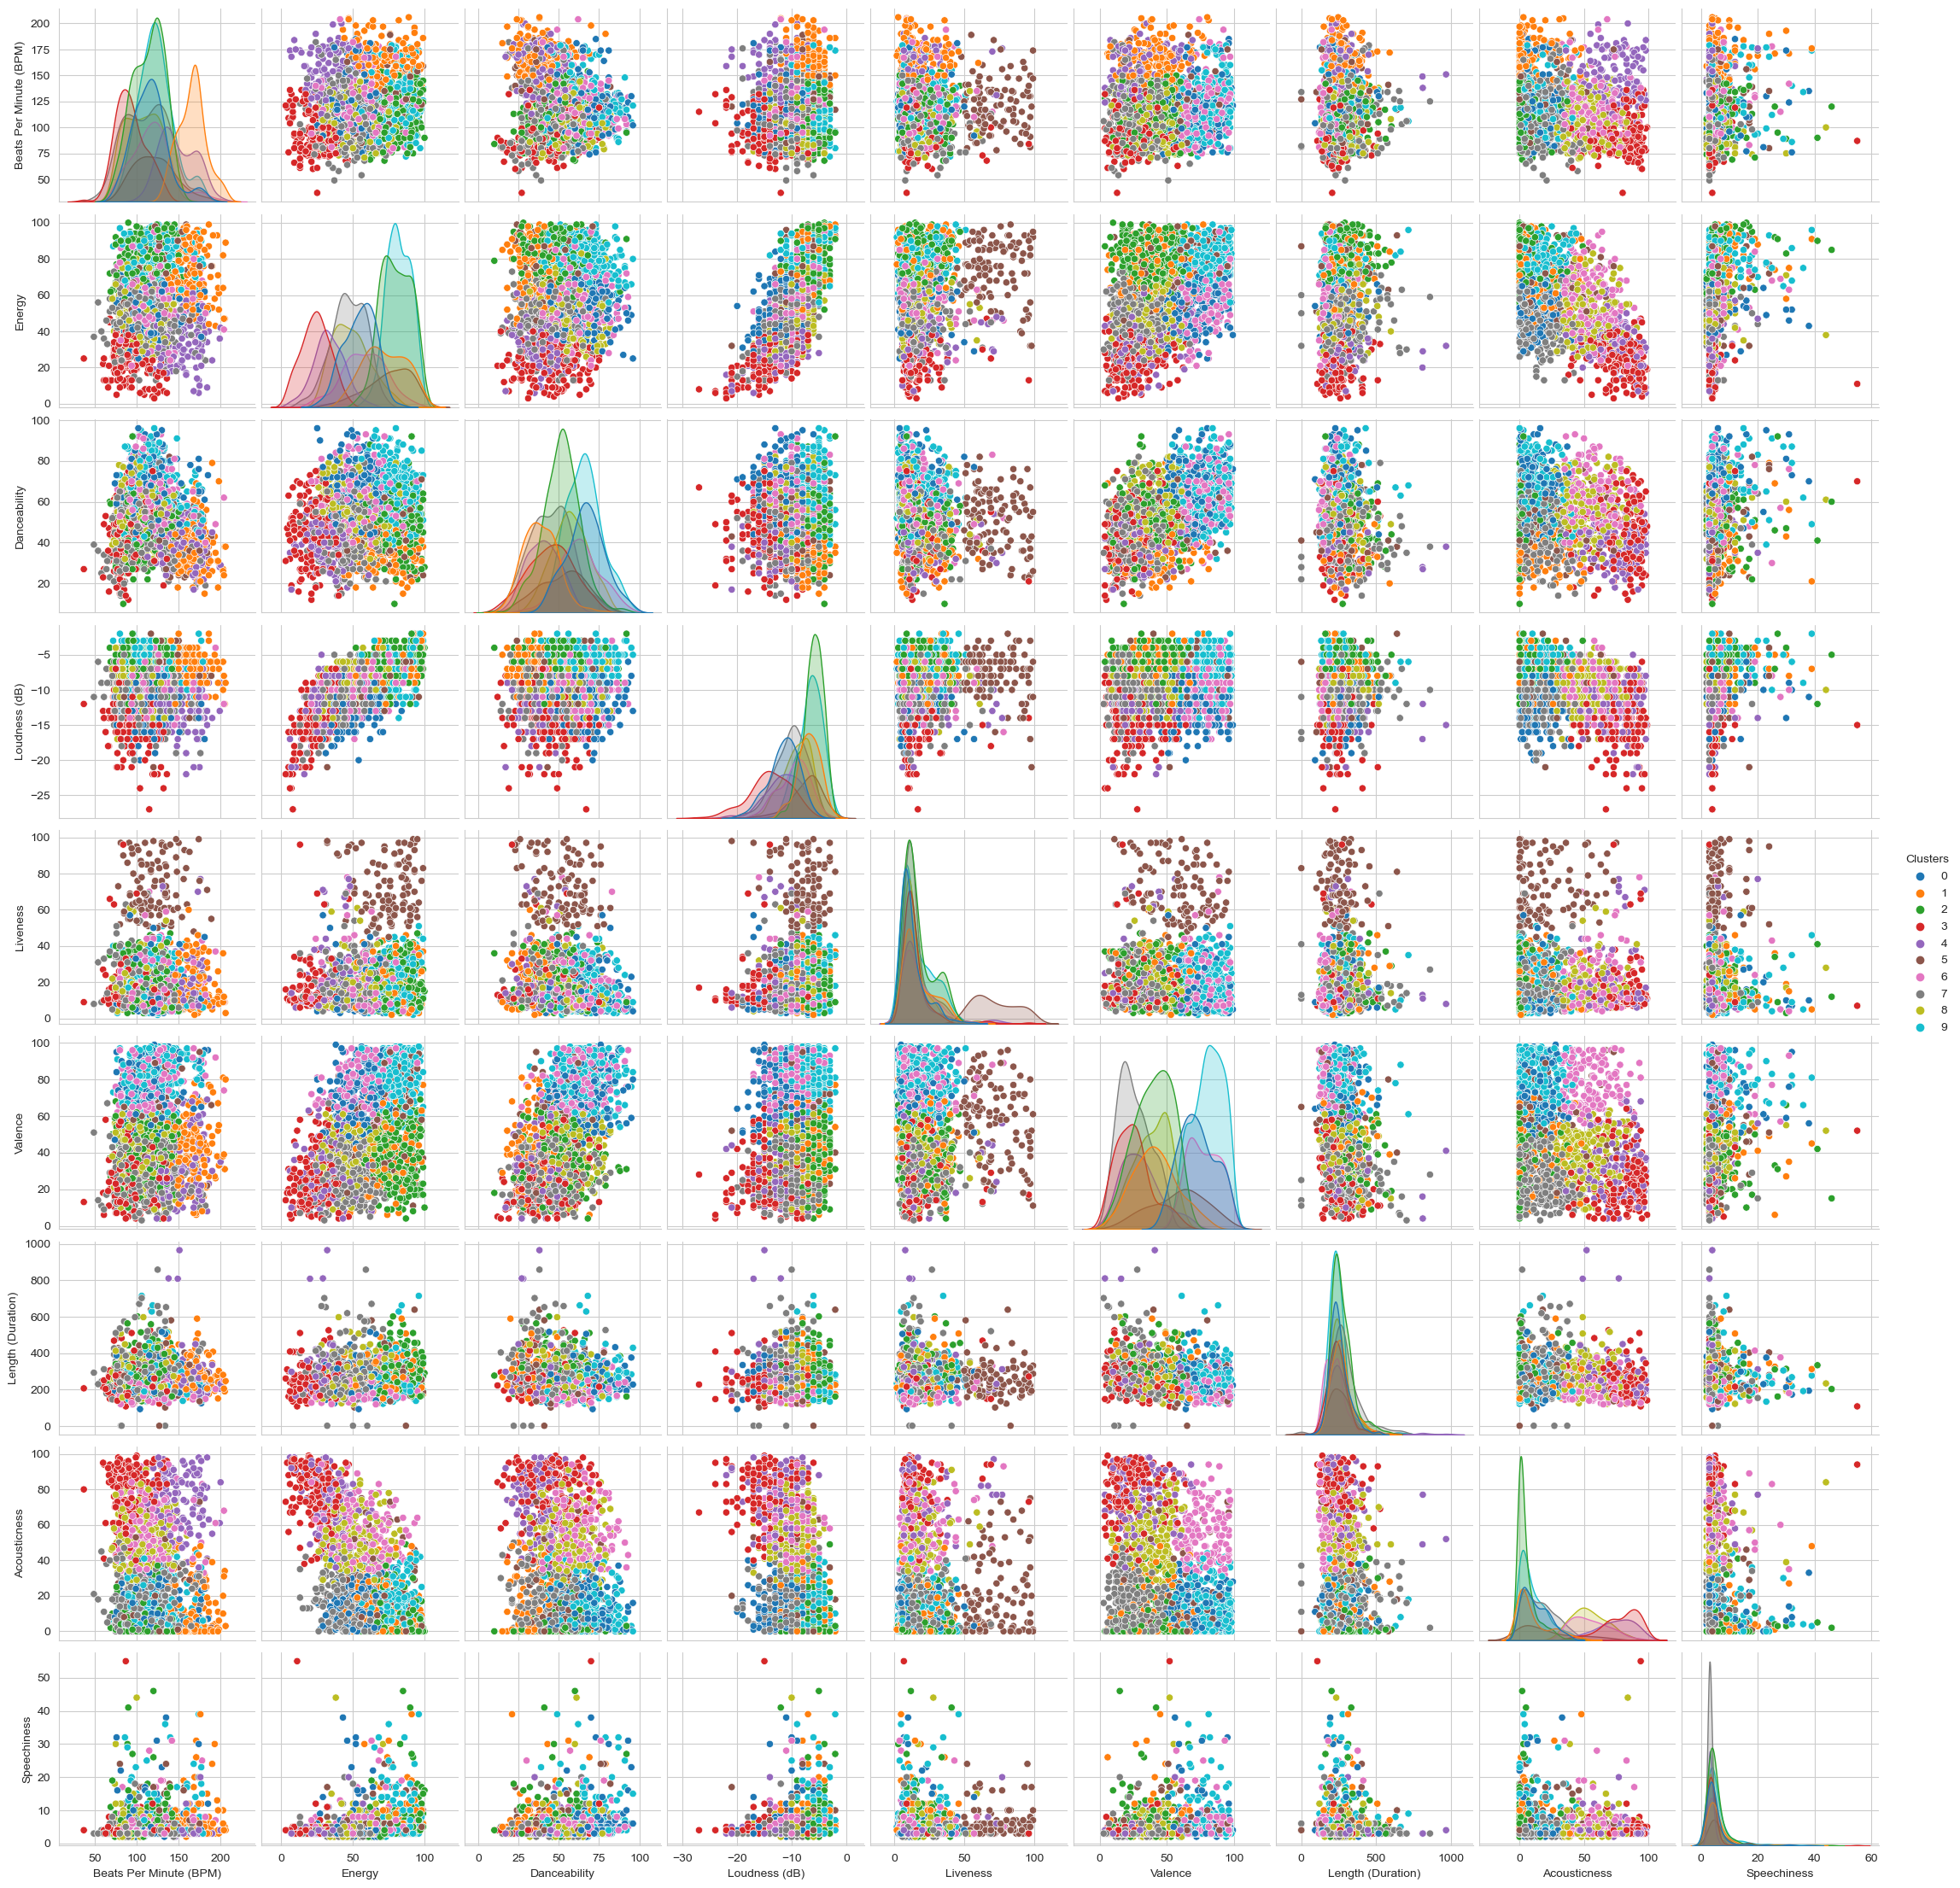
As you can notice, the clusters really cuts the data and describes it very well. I ran the clusters in the correlated data from the beginning of the project:
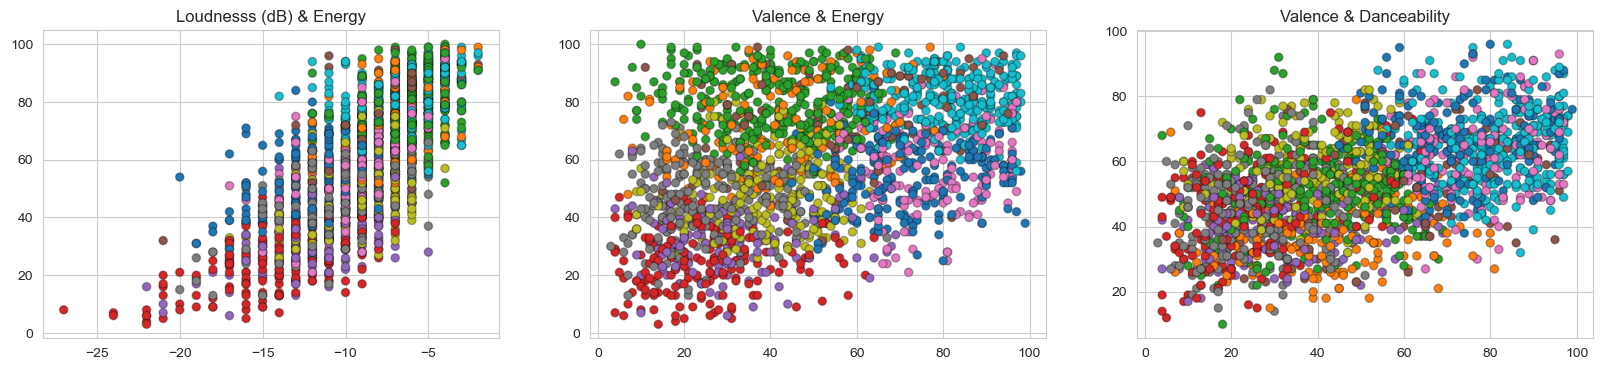
With this I concluded that 10 clusters in K-Means was the perfect fit for my problem, I recommend to really look at the plotly chart by running the entire [Notebook](https://github.com/liamarguedas/data/blob/main/Data-Science/Amazon-Music-Genres/Amazon-Music-Genres.ipynb).
## Summary
With this project we introduced a way to identify what kind of music does a person likes by analysing their current liked songs and not only by knowing about their lifestyle, hobbies, or profession. So it will be easy for the music streaming API to recommend music to a person, implementing a recomendation system trained together with the clusters for those users looking to taste new music similar to the ones they liked.
It is an efficient way of solving a little part of a bigger problem which is the recomendation system, good services are build step by step and clustering is a good starting poing for the company. I am satisfied with the results and I know they will be useful and easily implement in future systems.