https://github.com/liamarguedas/walmart-sales-forecast
Yearly Sales forecast for Walmart US Stores
https://github.com/liamarguedas/walmart-sales-forecast
data-science forecasting machine-learning
Last synced: 2 months ago
JSON representation
Yearly Sales forecast for Walmart US Stores
- Host: GitHub
- URL: https://github.com/liamarguedas/walmart-sales-forecast
- Owner: liamarguedas
- License: mit
- Created: 2023-06-07T19:21:44.000Z (about 3 years ago)
- Default Branch: main
- Last Pushed: 2023-06-08T20:22:53.000Z (about 3 years ago)
- Last Synced: 2025-01-18T11:41:44.958Z (over 1 year ago)
- Topics: data-science, forecasting, machine-learning
- Language: Jupyter Notebook
- Homepage:
- Size: 8.28 MB
- Stars: 3
- Watchers: 1
- Forks: 0
- Open Issues: 0
-
Metadata Files:
- Readme: README.md
- License: LICENSE
Awesome Lists containing this project
README
# Walmart Sales Forecast Project Summarize
## Problem description
There are many seasons that sales are significantly higher or lower than averages. If the Walmart does not know about these seasons, it can lose too much money. Predicting future sales is one of the most crucial plans for Walmart. Sales forecasting gives an idea to the company for arranging stocks, calculating revenue, and deciding to make a new investment.
Another advantage of knowing future sales is that achieving predetermined targets from the beginning of the seasons can have a positive effect on stock prices and investors perceptions. Also, not reaching the projected target could significantly damage stock prices, conversely. And, it will be a big problem especially for a company as a big Walmart.
## Decision Making process
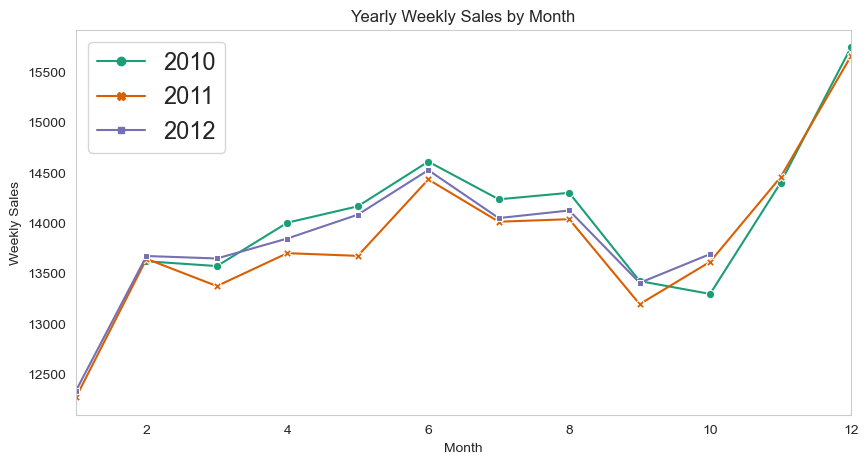
From the exploratory data analysis I noticed that most of the features from the data had strong correlation with the project target, so I decided to implement a regression solution for the problem at first, this decision changed rapidly when I realized an strong time series pattern of the weekly sales trough the years. From there I knew I needed to implement Seasonal and Non-seasonal time series models (ARIMA, SARIMA, STL, ES, ETS, VAR, LSTM, CNN, GBM).
In the project I still implemented a Random Forest Regressor in order to see how the features performed predicting the weekly sales. Even when the best solution for the problem was a time series model, creating a regression at first was a good decision and implementation since:
- It helped me set an starting point in the metrics performance.
- If someone in the future wanted to see how different descriptive values (Store size, Store type, fuel prices, etc..) would affect the weekly sales prediction, he or she can do it by looking at the feature importance of a regression.
- It helped me see an early performance since it did not need any kind of transformations and did not need to analyse different transformations performance in a regression.
The Random Forest Regressor showed pretty results in the testing data as you can see in the following chart:
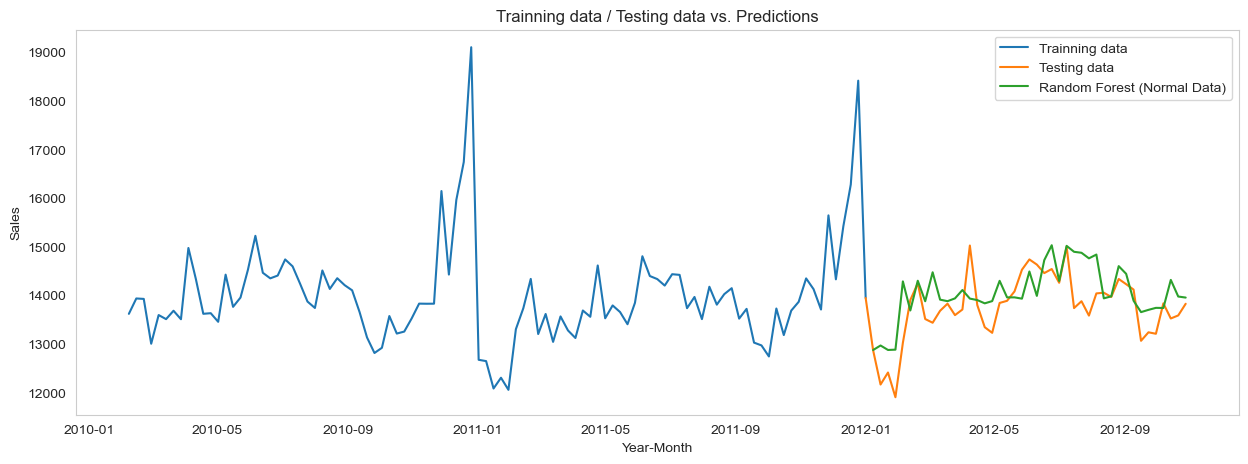
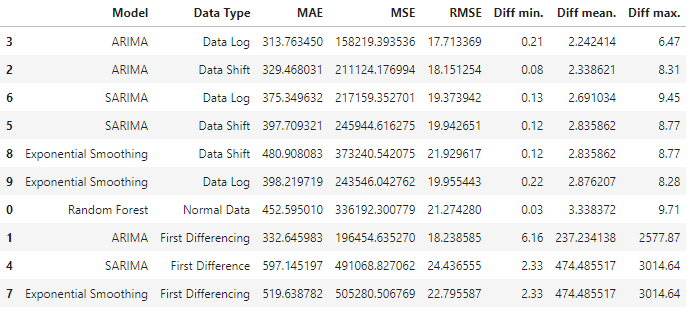
Random Forest Regressor ranked 7 out of the 9 different transformations / models we tested in this project. After the regression I realized that the data was not stationary, this is a particular problem for ARIMA based models. Since we need stationary in order to run a time series model I needed to make some transformations in the data and test each transformations with the models, the transformations applied to the data were:
- First Difference
- Second Difference
- Shift
- Log
Since First Difference, Shift and Log were the transformation that showed more stationary I decided to train the time series models in those transformations. I trained 3 different models:
- ARIMA
- SARIMA
- Exponential Smoothing
As you can see in the following statistics ARIMA with the Log transformation in the data showed the better predicting performance and the lower MAE, MSE and RMSE metrics:
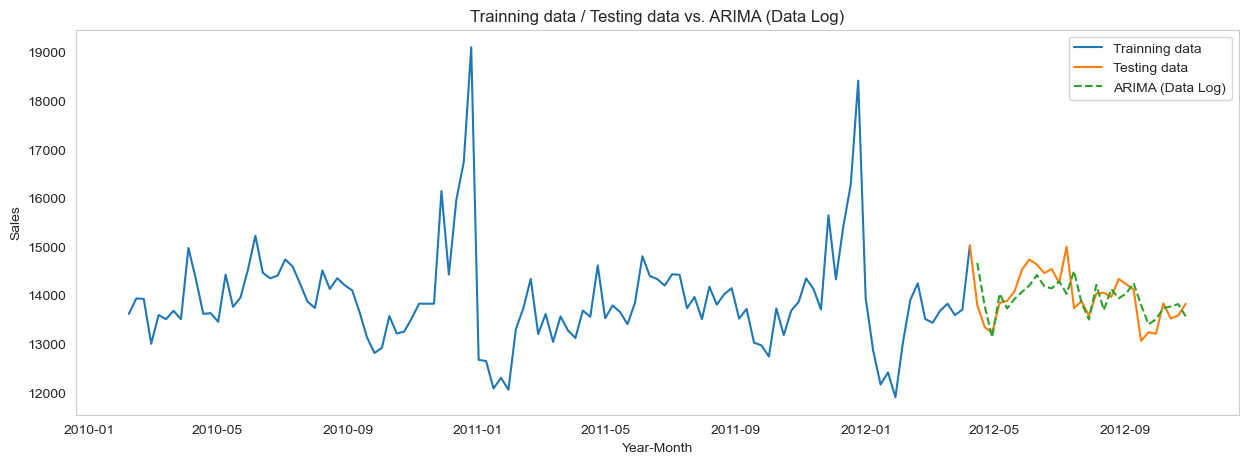
Plotting the ARIMA with Log transformation showed an amazing performance as described by the statistics:
By that time I have already taken the decision of using the ARIMA model, in order to take a final decision it was necessary to look at each data transformation performance in each model:
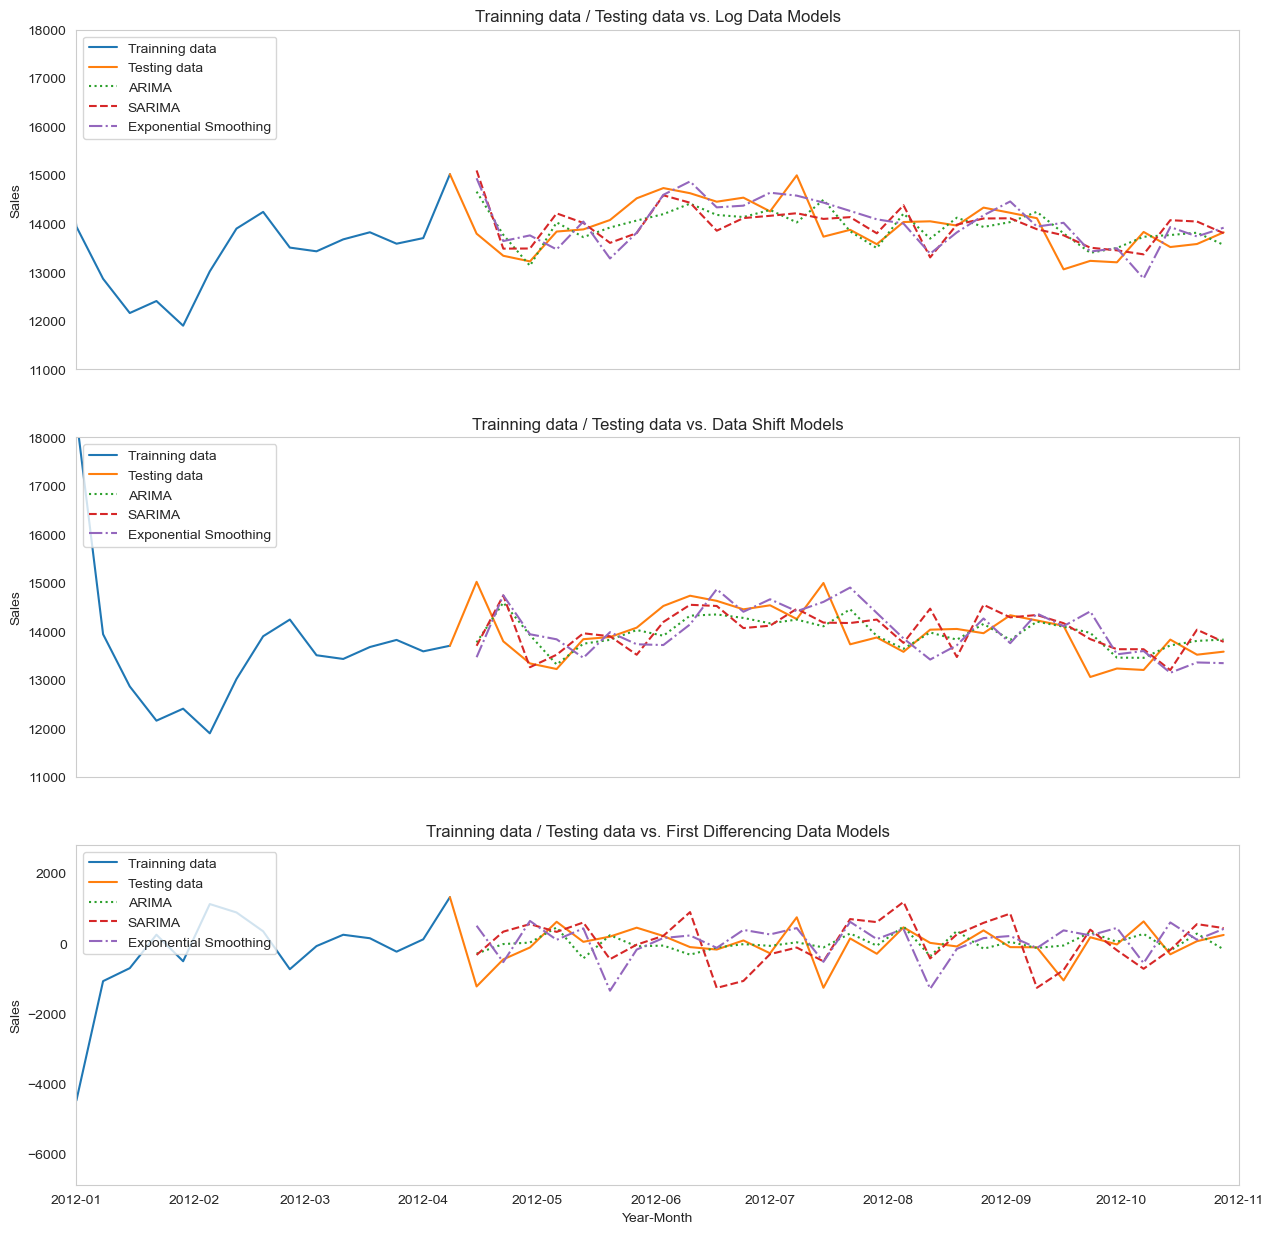
ARIMA in the shift and log transformation was the most accurate and the ones that showed the better statistics for our problem, so I decided to use them in order to take a final decision.
## Final Decision
To make a final decision I decided to choose between ARIMA in the log transformation and ARIMA in the shift transformation, since I did test the models in the testing data and I did not have more data available for testing, I choose to test in the entire dataset (Train + Test) and see how the both transformations perform against each other to take a final decision, both transformations showed an amazing performance with an ARIMA model as you can see in the following chart:
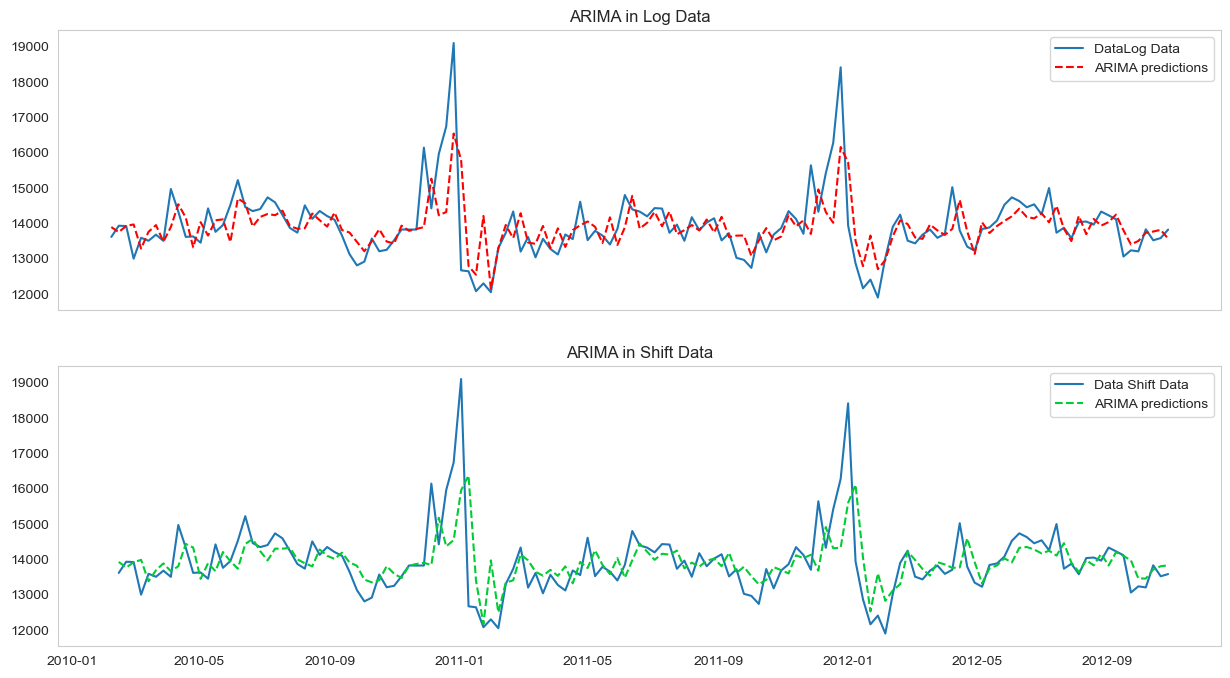
By looking at the statistics there was little difference in the metrics:

So It was a hard decision to choose between what type of data transformation to use since they're both had an amazing performance with the ARIMA model, I have chosen to use the Log transformation to end this project.
### Does the Data Log transformation with an ARIMA model solves the problem?
Yes, the performance presented and the statistics are good enought to safetly say that I can execute the model through the years and forecast a very accurate prediction of the weekly sales for Walmart. Besides the model is easily maintainable and retrainable, for future tunning and improvement.
I am accomplishing a low implementation and maintaining cost in case of deployment to the real world, through an easy pipline configuration the project can be feed with more data and use for real-time analysis in a dashboard for an accessible cost per hour. I have managed to solve the entire problem, developed a really good approach and an amazing data science project.