https://github.com/liatrio/backstage-dora-plugin
Backstage plugin to surface an organizations DORA metrics
https://github.com/liatrio/backstage-dora-plugin
backstage backstage-plugin dora dora-devops dora-metrics
Last synced: 4 months ago
JSON representation
Backstage plugin to surface an organizations DORA metrics
- Host: GitHub
- URL: https://github.com/liatrio/backstage-dora-plugin
- Owner: liatrio
- License: apache-2.0
- Created: 2024-08-27T15:57:11.000Z (almost 2 years ago)
- Default Branch: main
- Last Pushed: 2024-11-04T16:26:25.000Z (over 1 year ago)
- Last Synced: 2024-11-23T12:05:35.039Z (over 1 year ago)
- Topics: backstage, backstage-plugin, dora, dora-devops, dora-metrics
- Language: TypeScript
- Homepage: https://openo11y.dev/human-systems/delivery-metrics/lagging-delivery-indicators/
- Size: 4.36 MB
- Stars: 34
- Watchers: 4
- Forks: 2
- Open Issues: 10
-
Metadata Files:
- Readme: README.md
- Changelog: CHANGELOG.md
- Contributing: CONTRIBUTING
- License: LICENSE
- Codeowners: CODEOWNERS
Awesome Lists containing this project
README
# Backstage DORA Plugin
[](https://github.com/liatrio/backstage-liatrio-dora-plugin/actions/workflows/codeql.yml) [](https://opensource.org/licenses/Apache-2.0) [](https://github.com/liatrio/backstage-dora-plugin/actions/workflows/release.yml) 
This is a plugin for the [Backstage](https://backstage.io/) Project that provides a seamless way to display [DORA Metrics](https://dora.dev/guides/dora-metrics-four-keys/) in your developer portals.
Our goal is to provide an Open Source plugin that works with the Open Telemetry backend collecting your DORA metrics in a non-opinionated manner.
**This plugin is currently loosely tied to GitHub and Loki DB, we plan to expand to GitLab and other platforms in the future**
## Plugin Architecture

### Links to Modules
- [liatrio-otel-collector](https://github.com/liatrio/liatrio-otel-collector)
- [liatrio-dora-api](https://github.com/liatrio/liatrio-dora-api)
- [backstage-dora-plugin](https://github.com/liatrio/backstage-dora-plugin)
- [react-dora-charts](https://github.com/liatrio/react-dora-charts)
## Components
### `At A Glance`
This offers you a quick view of the state of a component or service.
Depending on how you have set up your configuration for this plugin, it will show:
- The individual DORA Metrics for the last 30 days
- `Deployment Frequency`- The average how often you are deploying, failed or successful
- Weekends, unless included, and holidays, if set, are subtracted from timespans that go over them
- `Change Lead Time` - The average of time merged to `main` to deployment success
- Weekends, unless included, and holidays, if set, are subtracted from timespans that go over them
- `Change Failure Rate` - The average number of changes that result in a failed deployment
- `Recovery Time` - The average of a failed deployment to the next successful deployment
- Regardless of configuration, includes weekends and does not subtract the holidays if set.
- The DORA Metrics overall trend over the last 30 days
- The Trend is calculated on a per-week basis
- If a component has gone stale or is too new, you will see a note about there not being enough data to render a trend.
- There is an option to also show each DORA Metric as a line on the graph, a legend will appear in this case
Here are some examples:
| Metric View with Details Always Showing | Metric View with Details on Hover |
| --------------------------------------------------------------------------------------------------------------------------- | ------------------------------------------------------------------------------------------------------------------------------------------ |
|  | 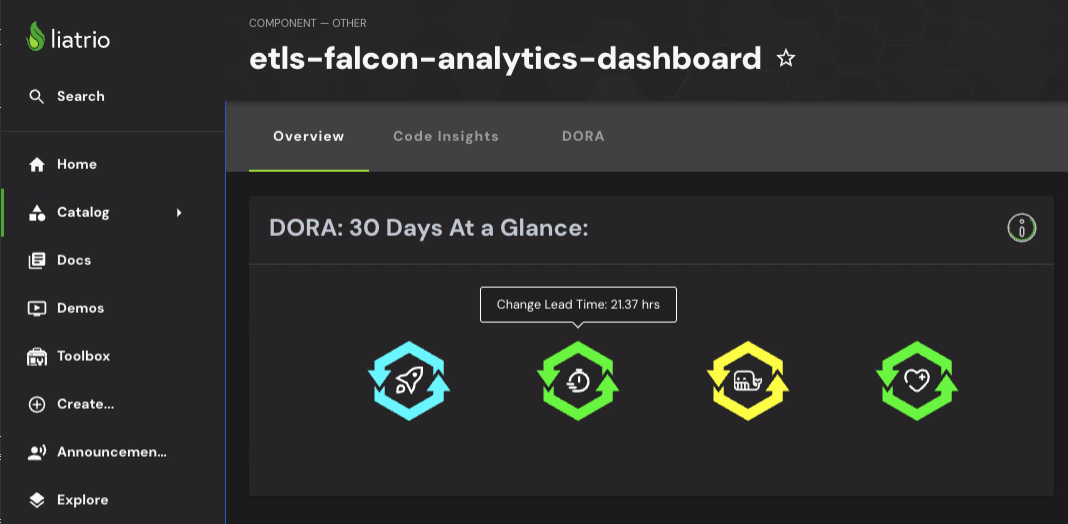 |
| Overall Trend View | Overall Trend View with Individual Metric Trends |
| ------------------------------------------------------------------------------------------------------------------------------- | ----------------------------------------------------------------------------------------------------------------------------------------- |
| 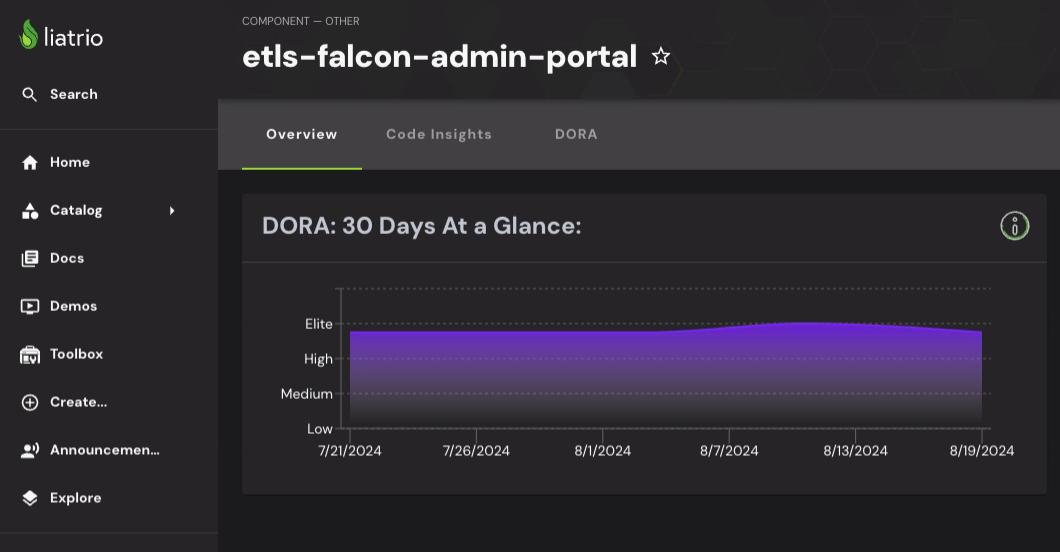 | 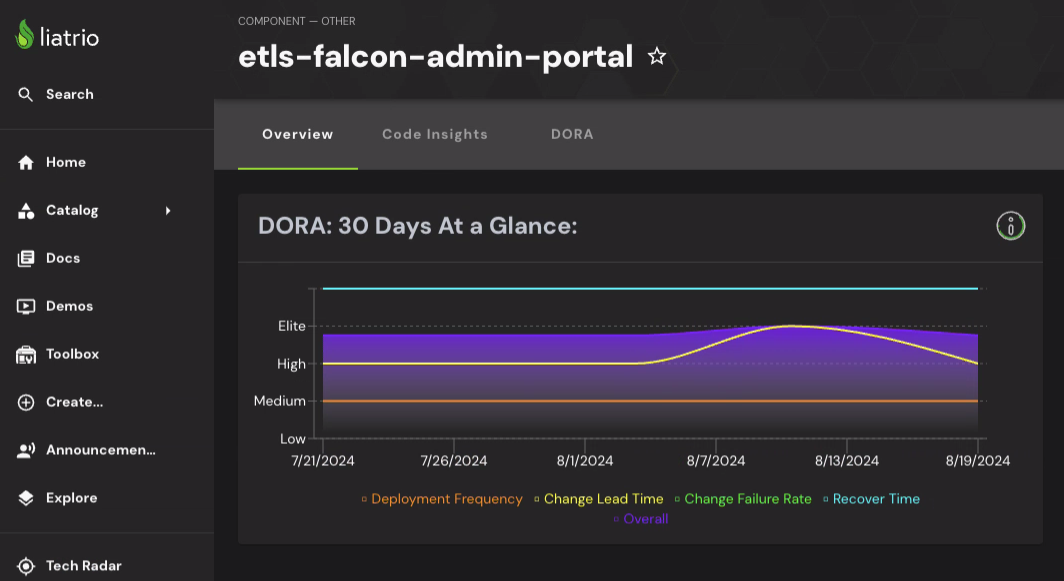 |
### `Charts`
This is a set of charts that for the DORA metrics.
It has two different modes `Service View` and `Component View`:
- `Component View` - You will see this when you access a specific Component in the Catalog.
- `Service View` - You will see this when you access the `DORA Metrics` sidebar navigation.
Here are some examples:
| Component View | Service View |
| ------------------------------------------------------------------------------------------------------------------------------ | ------------------------------------------------------------------------------------------------------------------------------ |
| 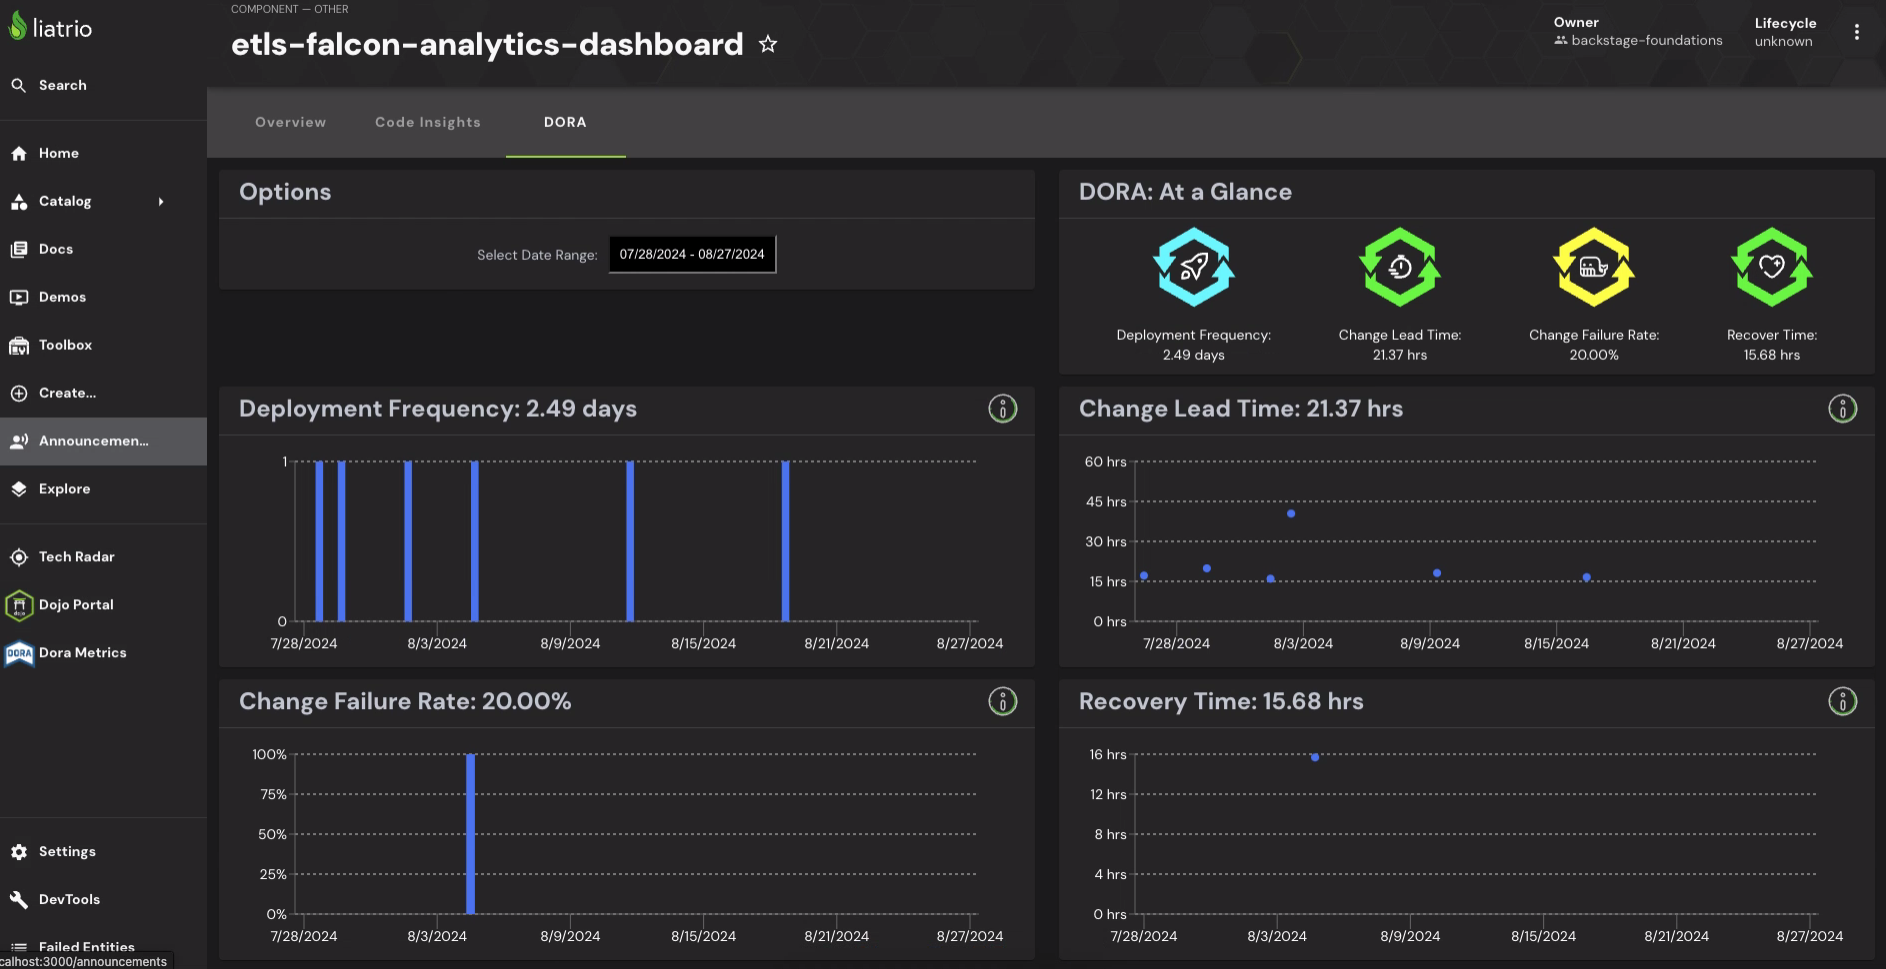 | 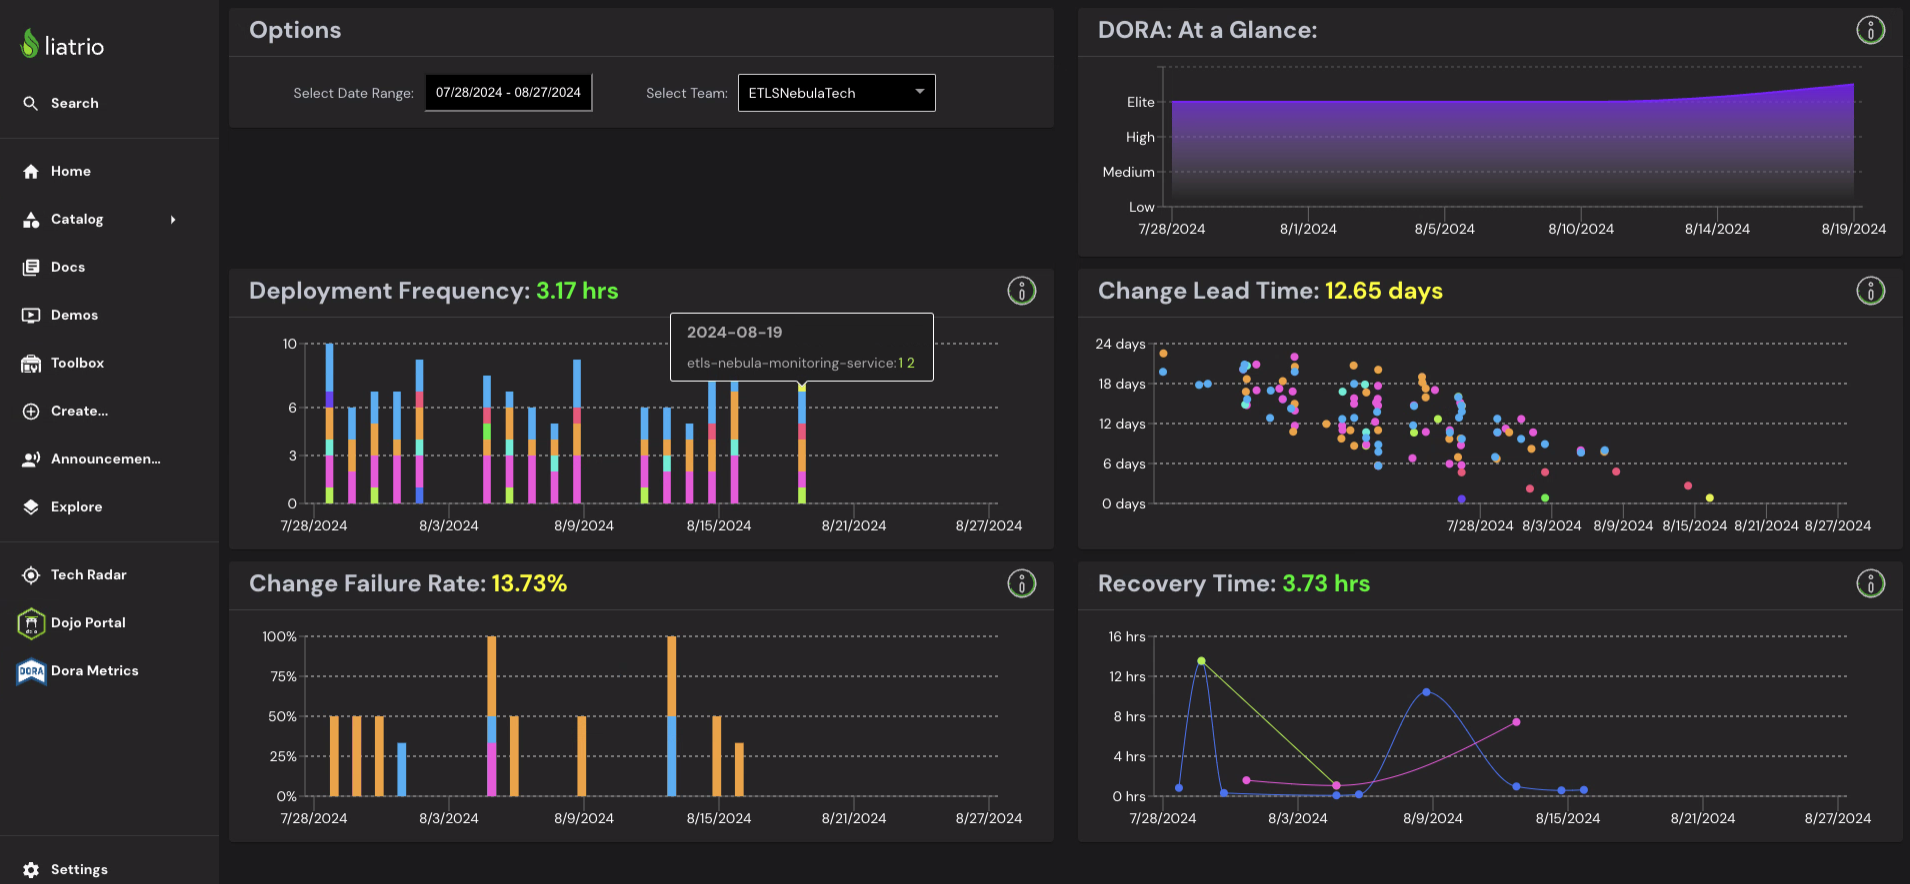 |
## Dependencies
This plugin relies on the following dependencies:
- [Liatrio DORA React Components](https://github.com/liatrio/react-dora-charts)
- [Liatrio OTel Collector](https://github.com/liatrio/liatrio-otel-collector)
- An instance of Loki DB
- **You can swap out for any Time Series DB, but you will need to fork and modify the [Liatrio DORA API](https://github.com/liatrio/liatrio-dora-api) to do so**
- A GitHub Organization hosting your repositories
- **We will expand this to more platforms in the future**
## Installation of Dependencies
### Docker Compose
In the `dependencies` folder, you will find a docker-compose file. Using this will spin up the following in docker containers:
- An instance of Loki DB with persistent storage
- An instance of Promtail, which is required by Loki DB
- An instance of an OTel Collector configured to accept events from GitHub
- An instance of the [Liatrio DORA API](https://github.com/liatrio/liatrio-dora-api), which this plugin can call to get the data it needs
You will need to update the `.env` file with your `GitHub Org`, `User` and `PAT` (with full repo access) for the API to be able to return a list of services
### Kubernetes
If you have a Kubernetes Cluster, we have a quick start guide that installs `Loki DB` and [Liatrio OTel Collector](https://github.com/liatrio/liatrio-otel-collector) (among a few other tools) that can be found [here](https://github.com/liatrio/tag-o11y-quick-start-manifests)
This quick start manifest does not set up the [Liatrio DORA API](https://github.com/liatrio/liatrio-dora-api) or any other API which you would need to sit between this plugin and the Loki DB.
### Configuring GitHub
Once you have the dependencies configured and running, you will need to update your GitHub Organization to send events to the OTel Collector.
You can do this by setting up a new `Webhook` and configuring the `Webhook` to send the following events:
- Deployments
- Issues
- Pull Requests
- Deployment Statuses
## Installation into Backstage
To Install this plugin you'll need to do the following:
1. Install the `@liatrio/backstage-dora-plugin` package into the `/packages/app` folder
```shell
npm install @liatrio/backstage-dora-plugin
yarn add @liatrio/backstage-dora-plugin
```
2. Update the `/packages/app/src/App.tsx` file:
- Add this to your imports:
```typescript
import { EntityDORACharts } from '@liatrio/backstage-dora-plugin';
```
- Add this into the `FlatRoutes` element as a child:
```typescript
} />
```
3. Update the `/packages/app/src/components/catalog/EntityPage.tsx` file:
- Add this to your imports:
```typescript
import {
EntityDORACharts,
EntityDORAAtAGlance,
} from '@liatrio/backstage-dora-plugin';
```
- Define this constant:
```typescript
const doraContent = (
{entityWarningContent}
);
```
- Add this into the `serviceEntityPage`, `websiteEntityPage`, `defaultEntityPage` `EntityLayoutWrapper` elements:
```typescript
{doraContent}
```
- Add this into the `overviewContent` `Grid`:
```typescript
```
4. Update the `app-config.yaml`:
- Add this to the `proxy.endpoints` and use the correct URL for your API:
```yaml
/dora/api:
target: [URL_TO_DORA_API]
```
- Add this root property `dora` to the file and then add the following under it:
- Required:
- `dataEndpoint`: This the endpoint on the proxy that provides the deployment data. If you are using the `liatrio-dora-api` this will be `data`
- `serviceListEndpoint`: This the endpoint on the proxy that provides the service and repo ownership data. If you are using the `liatrio-dora-api` this will be `services`
- `daysToFetch`: This is the number of days worth of data that will be fetched for the charts to have available for display
- Optional:
- `showWeekends`: This boolean will toggle the `Deployment Frequency Chart` to hide weekends or show them. The default is to hide them.
- `includeWeekends`: This boolean will toggle whether weekends are included in scoring your `Deployment Frequency` and `Change Lead Time`. The default is to exclude them.
- `showDetails`: This boolean will toggle whether or not the `DORA At a Glance` shows the exact scores on hover or as static text. The default is to show them on hover.
- `showTrendGraph`: Enabling this field will change the `DORA At a Glance` to be a Trend Graph rather than have Metric indicators
- `showIndividualTrends`: Enabling this field will add individual Metric Trends to the Trend Graph in the `DORA At a Glance` component
- `rankThresholds`: This is an object to override the default rank thresholds for DORA Score Board and is fully optional all the way down to the individual ranks.
There are 4 scores, all are optional:
- `deployment_frequency` measured in hours
- `change_lead_time` measured in hours
- `change_failure_rate` measured as a percentage
- `recover_time` measured in hours
Each score has the following rank options:
- `elite`
- `high`
- `medium`
**Note: Anything outside `medium` is considered `low`**
The default rank thresholds are:
- deployment_frequency
- elite: 24 (1 day or less)
- high: 168 (1 week or less)
- medium: 720 (1 month or less)
- change_lead_time
- elite: 24 (1 day or less)
- high: 168 (1 week or less)
- medium: 720 (1 month or less)
- change_failure_rate
- elite: 5
- high: 10
- medium: 45
- recover_time
- elite: 1 (1 hr or less)
- high: 24 (1 day or less)
- medium: 168 (1 week or less)
## Contributing
See [Contributing](./CONTRIBUTING) to Backstage Dora Plugin