Ecosyste.ms: Awesome
An open API service indexing awesome lists of open source software.
https://github.com/librato/librato-storm-kafka
Publish metrics from Storm+Kafka setups to Librato
https://github.com/librato/librato-storm-kafka
Last synced: 13 days ago
JSON representation
Publish metrics from Storm+Kafka setups to Librato
- Host: GitHub
- URL: https://github.com/librato/librato-storm-kafka
- Owner: librato
- Archived: true
- Created: 2012-11-21T23:56:41.000Z (almost 12 years ago)
- Default Branch: master
- Last Pushed: 2016-11-17T20:56:35.000Z (about 8 years ago)
- Last Synced: 2024-08-09T12:29:11.085Z (3 months ago)
- Language: Ruby
- Homepage:
- Size: 44.9 KB
- Stars: 23
- Watchers: 12
- Forks: 4
- Open Issues: 0
-
Metadata Files:
- Readme: README.md
Awesome Lists containing this project
README
# librato-storm-kafka
Automatically detects Kafka spouts from a Storm topology from
ZooKeeper, determines the Spout consumer offsets, connects to the
Kafka hosts/partitions and reads current JMX/offset stats, and
publishes topic metrics to [Librato
Metrics](https://metrics.librato.com). The metrics published from this
gem allow the user to graph consumer lag.
Intended to be run periodically, for example, from cron.
### Install
```
$ gem install librato-storm-kafka
```
### Requirements
* Storm 0.8.1+ topology
* storm-contrib dynamic-brokers branch
* Kafka 0.7.1+ with MX4J
Firewall requirements:
* Access to ZK servers
* Access to MX4J server on Kafka
* Access to Kafka on regular port (9092)
### Run
Run with minimal options:
```
$ librato-storm-kafka --email
--token
--zk-servers
--zk-prefix
```
### Options
* `email`: Email associated with your Librato Metrics account.
* `token`: API token for your Librato Metrics accounts.
* `prefix`: Prefix to use for metric names. Defaults to
**kafkastorm.**.
* `mx4j-port`: Port to connect to Kafka's MX4J port on (default 8082)
* `zk-servers`: Comma-separated list of ZK Servers.
* `zk-port`: ZK port (default 2181)
* `zk-prefix`: Prefix of Storm spout configs in ZK (What you pass to `SpoutConfig`)
* `floor-in-secs`: By default all measurements are posted with
the current time as the measure_time. This option,
specified as a value in seconds, will floor the
time by this value. For example, 300 would floor
all measure times to the 5 minute mark.
* `create_aws_custom_metrics`: Boolean (default false) to create pending_bytes custom metrics
* `aws_access_key_id`: The AWS access key if using custom metrics (defaults to `ENV['AWS_ACCESS_KEY_ID']`)
* `aws_secret_access_key`: The AWS secret key if using custom metrics (defaults to `ENV['AWS_SECRET_ACCESS_KEY']`)
* `aws_namespace`: The AWS namespace to use for custom metrics (defaults to `storm-kafka`)
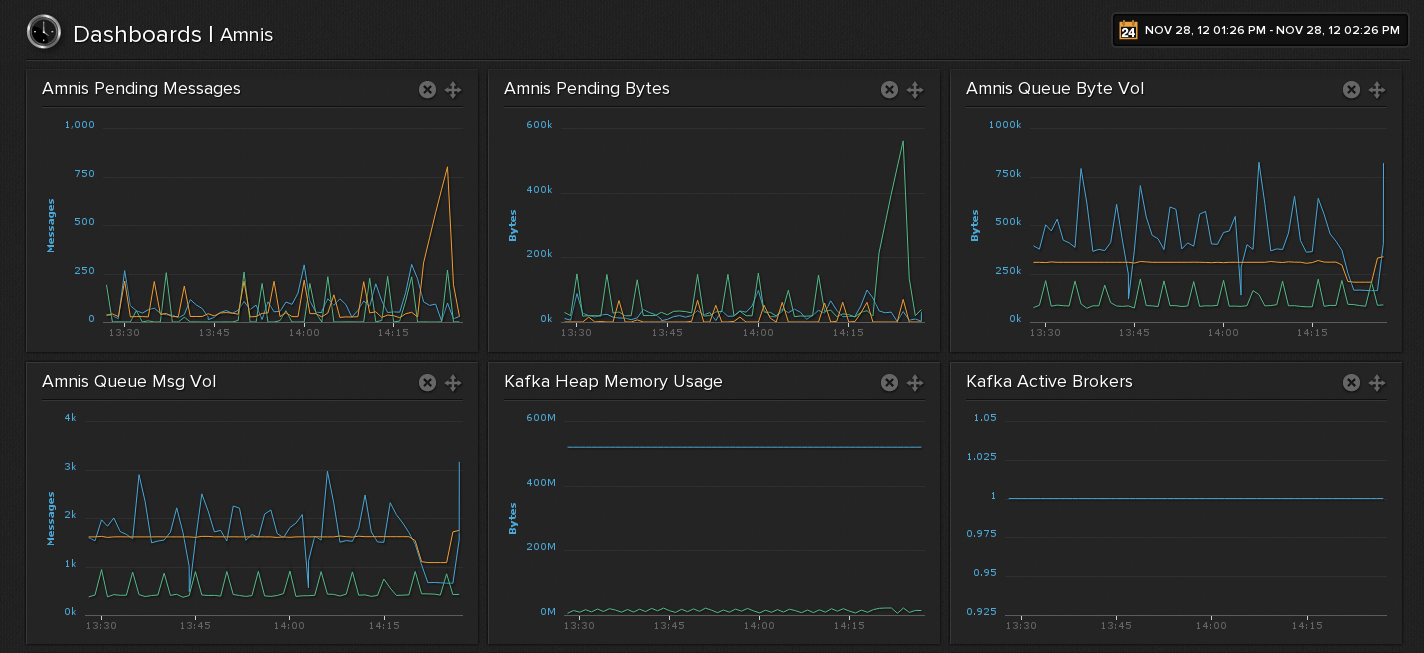
## Screenshots
The following is an example dashboard showing the metrics collected from three Storm topologies using a single Kafka broker.

## Contributing to librato-storm-kafka
* Check out the latest master to make sure the feature hasn't been implemented or the bug hasn't been fixed yet.
* Check out the issue tracker to make sure someone already hasn't requested it and/or contributed it.
* Fork the project.
* Start a feature/bugfix branch.
* Commit and push until you are happy with your contribution.
* Make sure to add tests for it. This is important so I don't break it in a future version unintentionally.
* Please try not to mess with the Rakefile, version, or history. If you want to have your own version, or is otherwise necessary, that is fine, but please isolate to its own commit so I can cherry-pick around it.
## Copyright
Copyright (c) 2012 Mike Heffner. See LICENSE.txt for
further details.