https://github.com/lineupjs/lineup_htmlwidget
HTMLWidget wrapper of LineUp for Visual Analysis of Multi-Attribute Rankings
https://github.com/lineupjs/lineup_htmlwidget
crosstalk htmlwidget htmlwidgets lineup r ranking shiny
Last synced: over 1 year ago
JSON representation
HTMLWidget wrapper of LineUp for Visual Analysis of Multi-Attribute Rankings
- Host: GitHub
- URL: https://github.com/lineupjs/lineup_htmlwidget
- Owner: lineupjs
- License: other
- Created: 2017-01-23T14:01:53.000Z (over 9 years ago)
- Default Branch: main
- Last Pushed: 2022-09-11T18:46:08.000Z (almost 4 years ago)
- Last Synced: 2025-03-28T13:21:16.524Z (over 1 year ago)
- Topics: crosstalk, htmlwidget, htmlwidgets, lineup, r, ranking, shiny
- Language: R
- Homepage: https://lineup.js.org
- Size: 3.33 MB
- Stars: 54
- Watchers: 6
- Forks: 9
- Open Issues: 2
-
Metadata Files:
- Readme: README.md
- License: LICENSE
Awesome Lists containing this project
- jimsghstars - lineupjs/lineup_htmlwidget - HTMLWidget wrapper of LineUp for Visual Analysis of Multi-Attribute Rankings (R)
- awesome-shiny-extensions - lineupjs - LineUp.js htmlwidget for interactive visual analysis of multi-attribute rankings. (Visualization / General-Purpose)
README
LineUp.js as HTMLWidget
=======================
[![License: MIT][mit-image]][mit-url] [![Github Actions][github-actions-image]][github-actions-url]
LineUp is an interactive technique designed to create, visualize and explore rankings of items based on a set of heterogeneous attributes.
This is a [HTMLWidget](http://www.htmlwidgets.org/) wrapper around the JavaScript library [LineUp.js](https://github.com/lineupjs/lineupjs). Details about the LineUp visualization technique can be found at [ https://jku-vds-lab.at/tools/lineup/](https://jku-vds-lab.at/tools/lineup/).
It can be used within standalone [R Shiny](https://shiny.rstudio.com/) apps or [R Markdown](https://rmarkdown.rstudio.com/) files.
[Crosstalk](https://rstudio.github.io/crosstalk/) is supported for synching selections and filtering among widgets.
Installation
------------
```R
install.packages('lineupjs')
library(lineupjs)
```
Examples
--------
```R
lineup(mtcars)
```
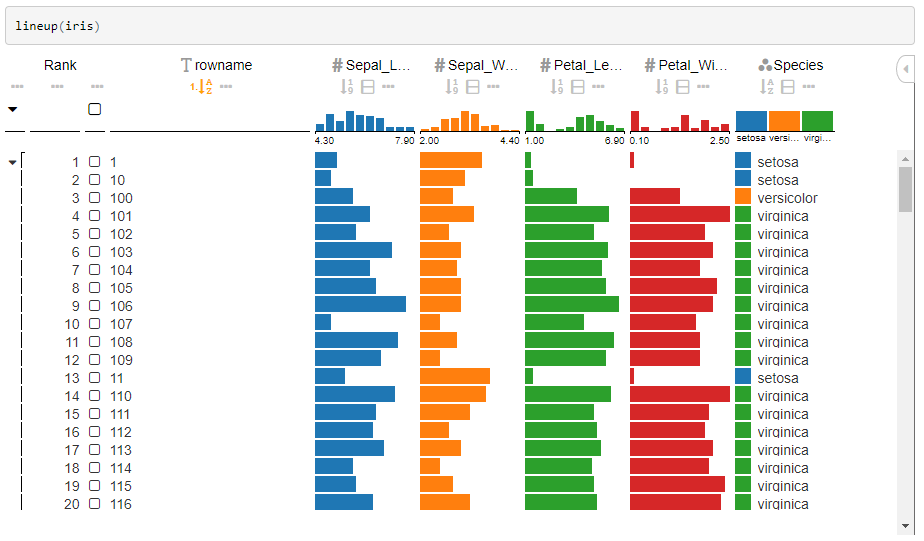
```R
lineup(iris)
```
Advanced Example
----------------
```R
lineup(iris,
ranking=lineupRanking(columns=c('_*', '*', 'impose'),
sortBy=c('Sepal_Length:desc'), groupBy=c('Species'),
impose=list(type='impose', column='Sepal_Length', categoricalColumn='Species')))
```

Crosstalk Example
-------------
```R
devtools::install_github("jcheng5/d3scatter")
library(d3scatter)
library(crosstalk)
shared_iris = SharedData$new(iris)
d3scatter(shared_iris, ~Petal.Length, ~Petal.Width, ~Species, width="100%")
```
```R
lineup(shared_iris, width="100%")
```

Shiny Example
-------------
```R
library(shiny)
library(crosstalk)
library(lineupjs)
library(d3scatter)
# Define UI for application that draws a histogram
ui <- fluidPage(
titlePanel("LineUp Shiny Example"),
fluidRow(
column(5, d3scatterOutput("scatter1")),
column(7, lineupOutput("lineup1"))
)
)
# Define server logic required to draw a histogram
server <- function(input, output) {
shared_iris <- SharedData$new(iris)
output$scatter1 <- renderD3scatter({
d3scatter(shared_iris, ~Petal.Length, ~Petal.Width, ~Species, width = "100%")
})
output$lineup1 <- renderLineup({
lineup(shared_iris, width = "100%")
})
}
# Run the application
shinyApp(ui = ui, server = server)
```
Hint:
In case you see scrollbars in each cell it is because of the font the cells are too narrow, you can specify a larger row height using
```R
lineup(iris, options=list(rowHeight=20))
```
Authors
-------
* Samuel Gratzl (@sgratzl)
* Datavisyn GmbH (@datavisyn)
[mit-image]: https://img.shields.io/badge/License-MIT-yellow.svg
[mit-url]: https://opensource.org/licenses/MIT
[github-actions-image]: https://github.com/lineupjs/lineup_htmlwidget/workflows/ci/badge.svg
[github-actions-url]: https://github.com/lineupjs/lineup_htmlwidget/actions