https://github.com/linuxfabrik/monitoring-plugins
220+ check plugins for Icinga and other Nagios-compatible monitoring applications. Each plugin is a standalone command line tool (written in Python) that provides a specific type of check.
https://github.com/linuxfabrik/monitoring-plugins
centos debian fedora icinga icinga-director icinga-plugins icinga2 icinga2-plugins linux linuxfabrik monitoring monitoring-plugins nagios nagios-checks nagios-plugins python rhel sles ubuntu windows
Last synced: 2 months ago
JSON representation
220+ check plugins for Icinga and other Nagios-compatible monitoring applications. Each plugin is a standalone command line tool (written in Python) that provides a specific type of check.
- Host: GitHub
- URL: https://github.com/linuxfabrik/monitoring-plugins
- Owner: Linuxfabrik
- License: unlicense
- Created: 2022-03-01T12:26:22.000Z (over 4 years ago)
- Default Branch: main
- Last Pushed: 2025-03-31T11:31:37.000Z (over 1 year ago)
- Last Synced: 2025-04-02T08:04:51.568Z (over 1 year ago)
- Topics: centos, debian, fedora, icinga, icinga-director, icinga-plugins, icinga2, icinga2-plugins, linux, linuxfabrik, monitoring, monitoring-plugins, nagios, nagios-checks, nagios-plugins, python, rhel, sles, ubuntu, windows
- Language: Python
- Homepage: https://linuxfabrik.ch
- Size: 23.4 MB
- Stars: 228
- Watchers: 16
- Forks: 59
- Open Issues: 101
-
Metadata Files:
- Readme: README.md
- Changelog: CHANGELOG.md
- Contributing: CONTRIBUTING.rst
- Funding: .github/FUNDING.yml
- License: LICENSE.txt
- Code of conduct: CODE_OF_CONDUCT.md
- Security: SECURITY.md
Awesome Lists containing this project
README
Linuxfabrik Monitoring Plugins
230+ monitoring plugins for Icinga, Nagios & friends. Python 3.9+, all platforms. Smart defaults, auto-discovery, consistent cross-platform metrics, minimal dependencies.
•
made by Linuxfabrik


[](https://www.bestpractices.dev/projects/9892)
[](https://scorecard.dev/viewer/?uri=github.com/Linuxfabrik/monitoring-plugins)
[](https://github.com/sponsors/Linuxfabrik)
[](https://www.paypal.com/cgi-bin/webscr?cmd=_s-xclick&hosted_button_id=7AW3VVX62TR4A&source=url)
# The Linuxfabrik Monitoring Plugins Collection
Nagios-compatible check plugins for Icinga, Naemon, Nagios and any other monitoring system that speaks the Nagios plugin API. Each plugin is a stand-alone CLI that reports one type of check: fast, consistent across platforms, minimal dependencies, reasonable defaults so WARN and CRIT only fire when it really matters.
Written in Python, released into the public domain under the [UNLICENSE](https://unlicense.org/). Runs on any platform with Python 3.9+ (Linux, Windows, macOS, FreeBSD). For Windows we also ship pre-compiled binaries, so Python is not required on the target.
## Documentation
Full documentation is available at [linuxfabrik.github.io/monitoring-plugins](https://linuxfabrik.github.io/monitoring-plugins/). It is automatically built and deployed on every push to `main`.
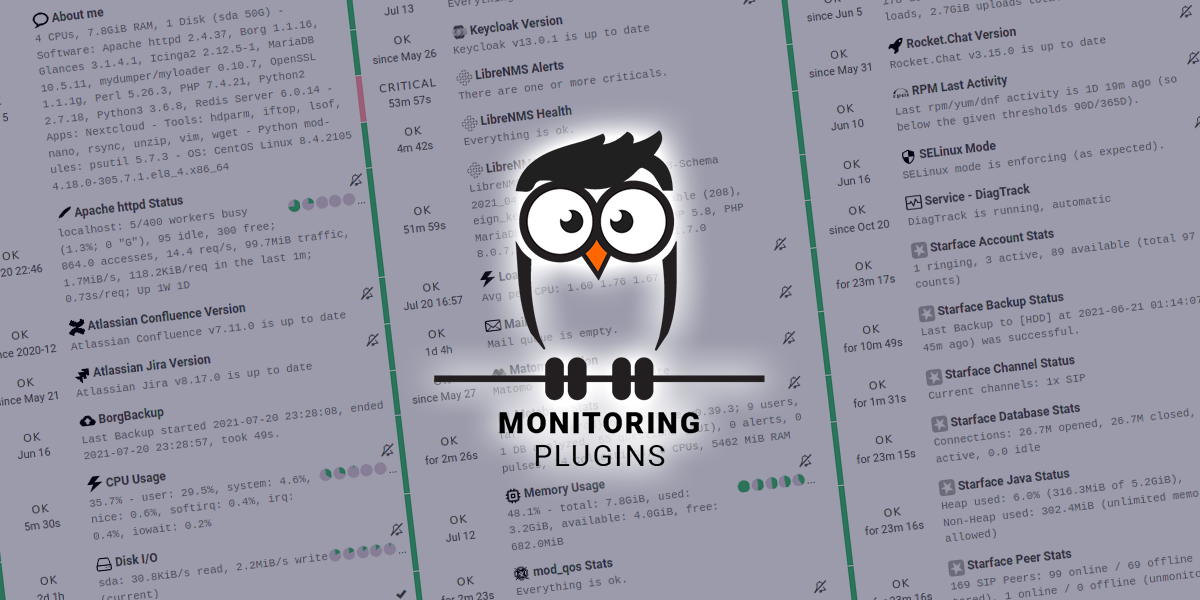
For a visual tour of what plugins look like in Icinga Web 2, see [POSTER.md](POSTER.md).
## Try it Live
A public demo with the plugins wired into Icinga Web 2 and Grafana:
[icinga-demo.linuxfabrik.ch](https://icinga-demo.linuxfabrik.ch/).
## Quick Start
After [installing](#installation), run a plugin directly to verify it works:
```text
$ /usr/lib64/nagios/plugins/cpu-usage
5.1% - user: 3.0%, system: 1.0%, irq: 0.5%, softirq: 0.5%
guest: 0.0%, guest_nice: 0.0%, iowait: 0.0%, nice: 0.0%, steal: 0.0%
ctx_switches: 8.5G, interrupts: 6.8G, soft_interrupts: 1.7G|'cpu-usage'=5.1%;80;90;0;100 ...
```
Every plugin supports `--help` and prints its version with `--version`.
## OS Compatibility
| Family | Tested releases | Notes |
| ----------------- | ----------------------------------------------------- | ---------------------------------- |
| Debian | 11 (bullseye), 12 (bookworm), 13 (trixie) | |
| RHEL and clones | Rocky 8, Rocky 9, Rocky 10 | Also Alma, CentOS Stream, Oracle. |
| SLE / openSUSE | SLE 15.5 | SLE 15 requires SP5. |
| Ubuntu | 20.04 (focal), 22.04 (jammy), 24.04 (noble) | 26.04 packages are built as well. |
| Windows | Windows Server 2016 and later, Windows 10 and later | Shipped as signed MSI, x86_64. |
Other Linux distributions run the plugins fine as long as Python 3.9 or newer is available; you just lose the pre-built native packages.
## Installation
The recommended path is our package repository for Linux (RPM/DEB) and the signed MSI for Windows. See [INSTALL.md](INSTALL.md) for per-distribution commands, the source-tarball and Git paths, sudoers drop-ins and SELinux bits.
Plugins that share setup steps:
* [Keycloak plugins](PLUGINS-KEYCLOAK.md)
* [MySQL / MariaDB plugins](PLUGINS-MYSQL.md)
* [Rocket.Chat plugins](PLUGINS-ROCKETCHAT.md)
* [WildFly / JBoss EAP plugins](PLUGINS-WILDFLY.md)
## Icinga, Grafana, Nagios
* **Icinga Director**: import the shipped basket (Host Templates, Service Templates, ~150 Service Sets, Time Periods, Notifications). See [ICINGA.md](ICINGA.md).
* **Grafana**: per-plugin dashboards under `check-plugins//grafana/`, provisioned with Grizzly today. See [GRAFANA.md](GRAFANA.md).
* **Plain Nagios, Naemon, Shinken, Sensu**: plugins emit standard Nagios plugin output and perfdata. Drop them into `/usr/lib64/nagios/plugins/` and reference them from your `command` definitions. Hosts, services and notifications stay in your existing configuration.
## Conventions
### Human-Readable Units
Byte sizes use IEC (KiB, MiB, GiB, powers of 2) so values match what the shell shows. Large numbers, times, and bits-per-second follow their own conventions. The full unit reference is in [UNITS.md](UNITS.md).
### Thresholds and Ranges
Where a check supports thresholds, `--warning` / `--critical` follow the [Nagios plugin format](https://nagios-plugins.org/doc/guidelines.html#THRESHOLDFORMAT) (`start:end`, `~` for negative infinity, `@` to invert). The full threshold reference with examples is in [THRESHOLDS.md](THRESHOLDS.md).
## FAQ
Q: **All pipe characters `|` in the output of any plugin are replaced with `!`. Why?**
A: We have to. The output syntax of Nagios plugins is fixed and not very flexible:
```
Output lines | Performance data
```
So the `|` character is reserved to separate plugin output from performance data. There is no way to escape it - so we have to replace it with `!`.
Q: **Can I overwrite specific plugins with its source code variant, if all other plugins are installed by the OS package manager?**
A: Of course. Just don't forget to install the libs either.
Q: **Do the OS packages have external dependencies?**
A: No.
Q: **Do the plugins also handle proxy environment variables like `HTTP_PROXY`?**
A: Yes, `HTTP_PROXY`, `HTTPS_PROXY`, `http_proxy` and `https_proxy` are automatically used by the Linuxfabrik monitoring plugins if they are set.
Q: **How can I remove the performance data after the `|` from the check output?**
A: In Bash, use `/usr/lib64/nagios/plugins/check-command | cut -f1 -d'|'`
## Troubleshooting
For installation-related issues (sudoers drop-ins, SELinux, Windows `0x80070005` under the Icinga Agent) see [INSTALL.md](INSTALL.md). For Icinga-specific quirks (passing `http_proxy` through Icinga, negative values in Director-dispatched parameters) see [ICINGA.md](ICINGA.md).
Q: **A plugin reports an unknown argument when I pass a value starting with `-`.**
A: argparse treats a value that starts with `-` as another option. Glue the value to the parameter instead of separating with a space:
* Long parameters: `./file-age --warning=-60:3600` (not `--warning -60:3600`).
* Short parameters: `./file-age -w-60:3600` (no space, no escape).
In Icinga Director, where arguments cannot be sent with `=`, prefix the first minus with a backslash (`\-60`); the `lib.base` library strips it before argparse sees it.
Q: **After an update, I get "Operational Error: no such column: ..., state UNKNOWN". On the next run, this disappears. What happened?**
A: Some check plugins require SQLite database files to cache data or to calculate data over time. After an update it is possible that the check plugin uses a new schema, but the database file on disk hasn't been updated (we don't implement database migrations). So in case of an "OperationalError", which happens for example when the plugin tries to INSERT into an outdated table, the database library simply deletes the sqlite database file. It will then be recreated from scratch by the plugin on the next run, with the updated database structure.
Q: **On Windows, sometimes Windows Defender randomly kills a plugin. Why?**
A: Depending on your signature versions or the healthiness of your signature cache, the Microsoft Windows Defender might classify a check as malicious (for example our `service.exe`). Please follow the steps below to clear cached detections and obtain the latest malware definitions.
1. Open command prompt as administrator and change directory to `c:\program files\windows defender`
2. Run `MpCmdRun.exe -removedefinitions -dynamicsignatures`
3. Run `MpCmdRun.exe -SignatureUpdate`
## Reporting Issues
1. [Submit an issue](https://github.com/Linuxfabrik/monitoring-plugins/issues/new/choose) (preferred).
2. [Contact us](https://www.linuxfabrik.ch/en/contact) by email or web form and describe your problem.
For vulnerabilities, follow the private disclosure process in [SECURITY.md](SECURITY.md).
## Contributing
See [CONTRIBUTING.md](CONTRIBUTING.md) for check-plugin developer guidelines, coding conventions, and the basket / Grafana deliverables. The [example plugin](https://github.com/Linuxfabrik/monitoring-plugins/blob/main/check-plugins/example/example) is the reference skeleton.
Compiling and packaging (RPM, DEB, Windows MSI, Code Signing) is documented in [BUILD.md](BUILD.md). Helper scripts under `tools/` (basket generation, docs build, unit-test and linter runners) are described in [TOOLS.md](TOOLS.md).
## Support the Project
Enterprise support, including an SLA and custom plugin development, is available via a [Service Contract](https://www.linuxfabrik.ch/en/products/service-support).
If these plugins help you, consider a donation via
[GitHub Sponsors](https://github.com/sponsors/Linuxfabrik) or
[PayPal](https://www.paypal.com/cgi-bin/webscr?cmd=_s-xclick&hosted_button_id=7AW3VVX62TR4A&source=url).
Past sponsors are listed in [SPONSORS.md](SPONSORS.md); community quotes in
[TESTIMONIALS.md](TESTIMONIALS.md). Sharing the project on social media, in
blog posts or via the [Show and tell category](https://github.com/Linuxfabrik/monitoring-plugins/discussions/categories/show-and-tell)
on GitHub Discussions is always welcome.
There is no fixed roadmap. Milestones are driven by customer needs and by contributors' time.