https://github.com/lloydzhou/rc-echart
React component wrapper for Apache ECharts based on TypeScript.
https://github.com/lloydzhou/rc-echart
chart charting-library charts echarts react tsx typescript visualization
Last synced: 3 months ago
JSON representation
React component wrapper for Apache ECharts based on TypeScript.
- Host: GitHub
- URL: https://github.com/lloydzhou/rc-echart
- Owner: lloydzhou
- License: mit
- Created: 2022-11-05T17:29:46.000Z (over 2 years ago)
- Default Branch: master
- Last Pushed: 2023-11-09T20:26:43.000Z (over 1 year ago)
- Last Synced: 2025-01-03T09:17:30.193Z (6 months ago)
- Topics: chart, charting-library, charts, echarts, react, tsx, typescript, visualization
- Language: TypeScript
- Homepage:
- Size: 432 KB
- Stars: 12
- Watchers: 2
- Forks: 0
- Open Issues: 3
-
Metadata Files:
- Readme: README.md
- License: LICENSE
Awesome Lists containing this project
- awesome-echarts - tsxecharts - React component wrapper for ECharts based on TypeScript. (Frameworks / React Component)
README
# rc-echart
React component wrapper for [Apache ECharts](https://github.com/apache/echarts) based on TypeScript.


## 项目设计
1. 参考[vuecharts3](https://github.com/lloydzhou/vuecharts)对echarts进行封装
2. 将echarts官方抽象的`series`以及其他的一些组件抽象成为`React`的组件使用,每一个组件负责管理自己的配置项。
3. 这些配置项统一的合并到`Chart`画布组件。再统一的通过`chart.setOption`更新到图表上
## 安装
```
yarn add rc-echart echarts
```
## Components
1. 定义一个`Chart`组件作为画布
2. 将[echarts官方配置项](https://echarts.apache.org/zh/option.html#title)每一个配置项使用统一的工厂函数构造成`React Component`
3. 项目导出组件列表
||导出组件|
|---|---|
|series|`Line`, `Bar`, `Pie`, `Scatter`, `EffectScatter`, `Radar`, `Tree`, `Treemap`, `Sunburst`, `Boxplot`, `Candlestick`, `Heatmap`, `Map`, `Parallel`, `Lines`, `Graph`, `Sankey`, `Funnel`, `Gauge`, `PictorialBar`, `ThemeRiver`, `Custom`|
|axis|`XAxis`, `YAxis`, `Polar`, `RadiusAxis`, `AngleAxis`, `RadarAxis`, `ParallelCoordinates`(`parallel`), `ParallelAxis`, `SingleAxis`, `Calendar`|
|dataZoom|`DataZoom`, `Inside`, `Slider`|
|visualMap|`VisualMap`, `Continuous`, `Piecewise`|
|graphic|`Graphic`, `Group`, `Image`, `Text`, `Rect`, `Circle`, `Ring`, `Sector`, `Arc`, `Polygon`, `Polyline`, `GraphicLine`(`graphic.elements-line`), `BezierCurve`|
|other|`Title`, `Legend`, `Grid`, `Tooltip`, `AxisPointer`, `Toolbox`, `Brush`, `Geo`, `Timeline`, `Dataset`, `Aria`|
|gl|`Globe`, `Geo3d`, `Mapbox3d`, `Grid3D`, `XAxis3D`, `YAxis3D`, `ZAxis3D`, `Scatter3D`, `Bar3D`, `Line3D`, `Lines3D`, `Map3D`, `Surface`, `Polygons3D`, `ScatterGL`, `GraphGL`, `FlowGL`|
## DEMO
[online demo](https://codesandbox.io/s/tsxecharts-demo-r9wi86?file=/src/App.tsx)
```
import 'echarts'
import { Chart, Line, Bar, Title, Grid, XAxis, YAxis, Tooltip } from 'rc-echart'
function App() {
return (
)
}
```

## 自定义组件
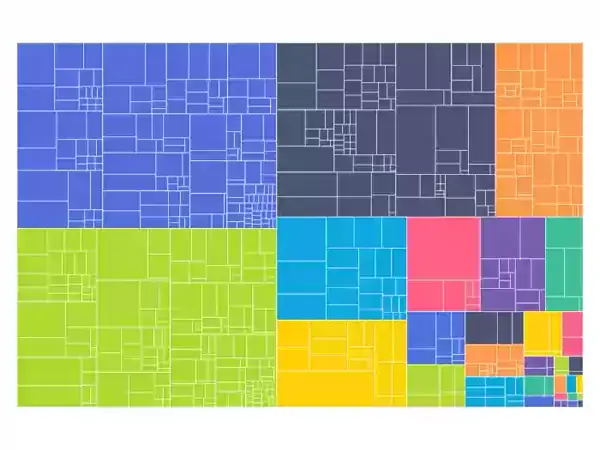
1. 通过自定义组件实现官方切换图像的[example](https://echarts.apache.org/examples/zh/editor.html?c=treemap-sunburst-transition)
```
function TreemapSunburstTransition() {
const [type, setType] = useState('')
const [data, setData] = useState()
const interval = useRef()
const id = 'echarts-package-size'
useEffect(() => {
const url = "https://fastly.jsdelivr.net/gh/apache/echarts-website@asf-site/examples/data/asset/data/echarts-package-size.json"
fetch(url).then(res => res.json()).then(data => {
setData(data.children)
let type = ''
console.log('data.value', data.children)
interval.current && clearInterval(interval.current);
// @ts-ignore
interval.current = setInterval(function () {
setType(type = type === 'treemap' ? 'sunburst' : 'treemap')
console.log('state.type', type)
}, 3000);
})
return () => interval.current && clearInterval(interval.current)
}, [])
if (type === 'treemap') {
return
}
return
}
function App() {
return (
)
}
```

## echarts-gl demo
[echarts-gl demo](https://codesandbox.io/s/tsxecharts-gl-demo-n20g3n?file=/src/App.tsx)
