https://github.com/lon9/covid
Simple and easy to understand visualization of COVID-19 it's automatically updated at 18:00 (JST)
https://github.com/lon9/covid
covid-19 javascript nuxtjs visualization vuejs
Last synced: about 2 months ago
JSON representation
Simple and easy to understand visualization of COVID-19 it's automatically updated at 18:00 (JST)
- Host: GitHub
- URL: https://github.com/lon9/covid
- Owner: lon9
- Created: 2020-03-04T07:55:19.000Z (about 5 years ago)
- Default Branch: master
- Last Pushed: 2020-09-12T16:39:40.000Z (over 4 years ago)
- Last Synced: 2025-01-29T07:36:45.325Z (4 months ago)
- Topics: covid-19, javascript, nuxtjs, visualization, vuejs
- Language: Vue
- Homepage: https://mystifying-roentgen-8441a2.netlify.com/
- Size: 1020 KB
- Stars: 0
- Watchers: 2
- Forks: 0
- Open Issues: 1
-
Metadata Files:
- Readme: README.md
Awesome Lists containing this project
README
# COVID-19
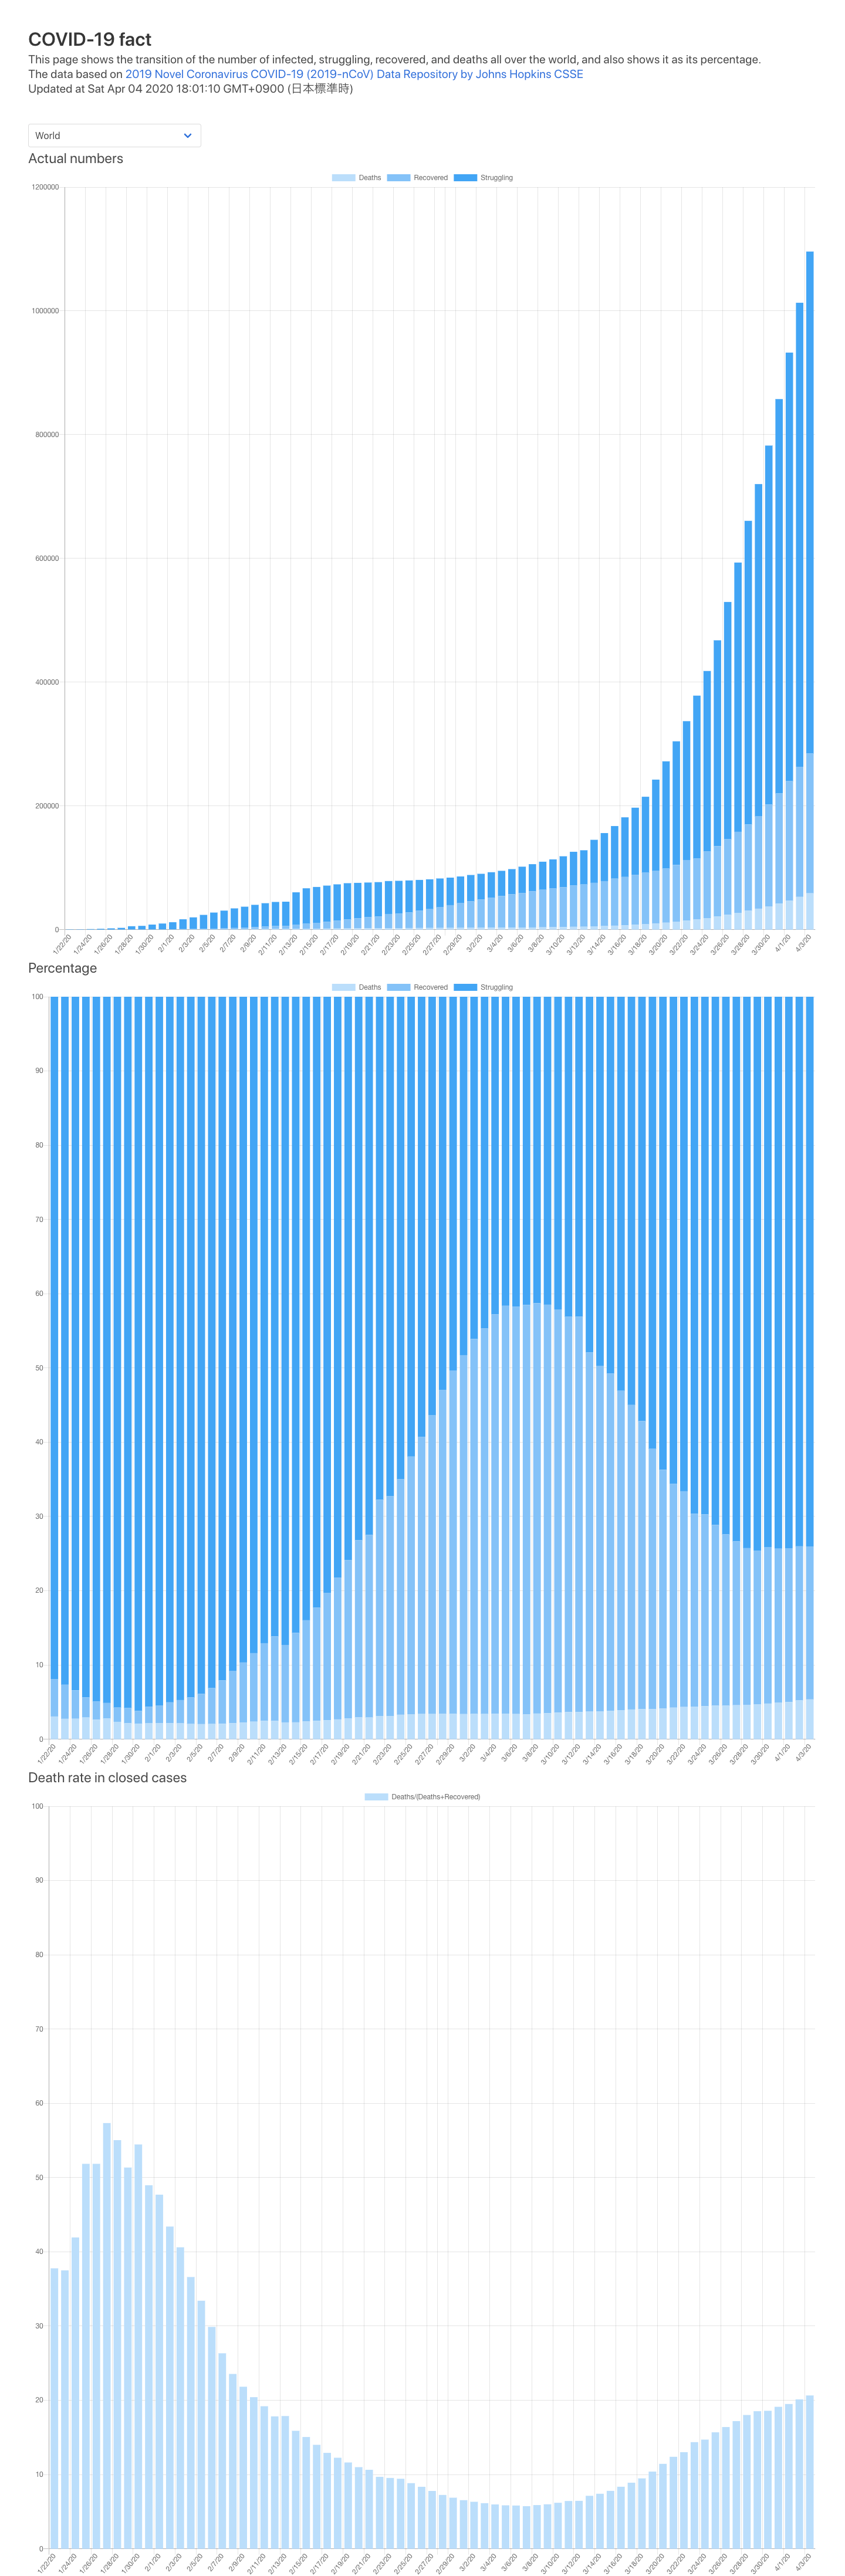
This is the page shows the transition of COVID-19 with actual numbers and percentage, it's simple and easy to understand.
The data is based on [2019 Novel Coronavirus COVID-19 (2019-nCoV) Data Repository by Johns Hopkins CSSE](https://github.com/CSSEGISandData/COVID-19)
[](https://gyazo.com/0d452e62a9d17909459741c5cac978cd)