https://github.com/lucrib/locust_influx
Send information about locust requests to influxdb.
https://github.com/lucrib/locust_influx
influxdb locust locust-plugin locustio
Last synced: 6 months ago
JSON representation
Send information about locust requests to influxdb.
- Host: GitHub
- URL: https://github.com/lucrib/locust_influx
- Owner: lucrib
- License: apache-2.0
- Created: 2019-08-24T18:44:42.000Z (almost 7 years ago)
- Default Branch: master
- Last Pushed: 2020-05-26T11:34:25.000Z (about 6 years ago)
- Last Synced: 2025-10-27T19:25:24.005Z (8 months ago)
- Topics: influxdb, locust, locust-plugin, locustio
- Language: Python
- Size: 708 KB
- Stars: 19
- Watchers: 5
- Forks: 13
- Open Issues: 5
-
Metadata Files:
- Readme: README.md
- License: LICENSE
Awesome Lists containing this project
README
# locust_influx
Send information about [locust](https://locust.io/) requests
to [InfluxDB](https://www.influxdata.com/products/influxdb-overview/)
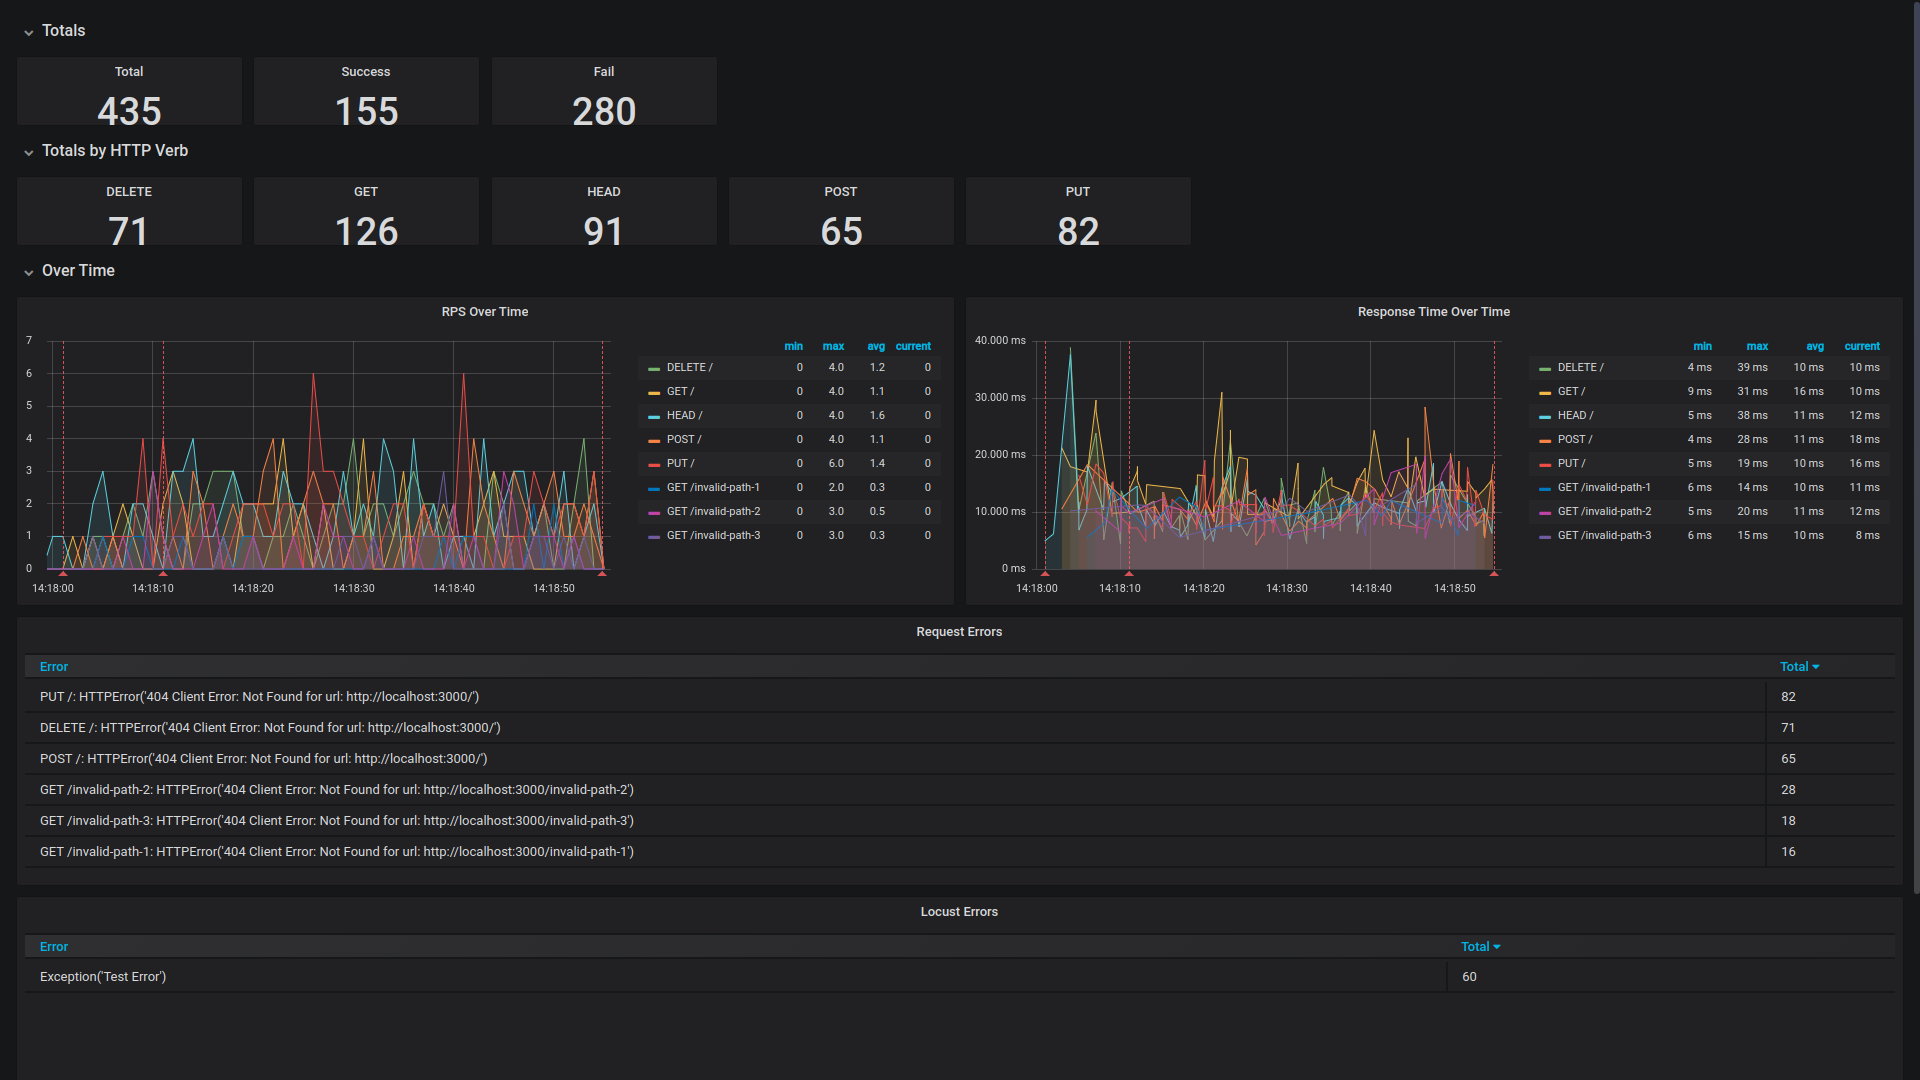
and follow the progress through [Grafana](https://grafana.com/) charts.
## Test and taste it locally
Start an InfluxDB container locally:
`docker run -d --name influxdb -d -p 8086:8086 influxdb`
Start a Grafana container locally:
`docker run -d --name grafana -d -p 3000:3000 grafana/grafana`
Crete a new [python virtual environment](https://docs.python.org/3/tutorial/venv.html) and install `locust_influx`:
`pip install locust_influx`
Run the example locustfile contained in this repo (Change the host to point to desired one):
`locust -f ./locustfile.py --no-web --clients 10 --hatch-rate 1 --run-time 60s --host http://localhost:8080`
Open your local Grafana in the browser at [http://localhost:3000/](http://localhost:3000/)
Import the example dashboard from `locust_dashboard.json` file.