https://github.com/ludofleury/guzzlebundle
Debug your API Calls with a Symfony web profiler for guzzle
https://github.com/ludofleury/guzzlebundle
Last synced: 6 months ago
JSON representation
Debug your API Calls with a Symfony web profiler for guzzle
- Host: GitHub
- URL: https://github.com/ludofleury/guzzlebundle
- Owner: ludofleury
- License: mit
- Created: 2012-12-16T23:16:55.000Z (almost 13 years ago)
- Default Branch: master
- Last Pushed: 2017-11-18T12:13:13.000Z (almost 8 years ago)
- Last Synced: 2025-03-31T11:05:25.565Z (6 months ago)
- Language: PHP
- Homepage: http://ludofleury.github.io/GuzzleBundle/
- Size: 2.07 MB
- Stars: 82
- Watchers: 5
- Forks: 21
- Open Issues: 4
-
Metadata Files:
- Readme: README.md
Awesome Lists containing this project
README
# Guzzle Bundle [](https://travis-ci.org/ludofleury/GuzzleBundle) [](https://packagist.org/packages/playbloom/guzzle-bundle) [](https://packagist.org/packages/playbloom/guzzle-bundle)
Provide a basic logger and an advanced profiler for Guzzle
* The basic logger use the default Symfony app logger, it's safe to use in your production environement.
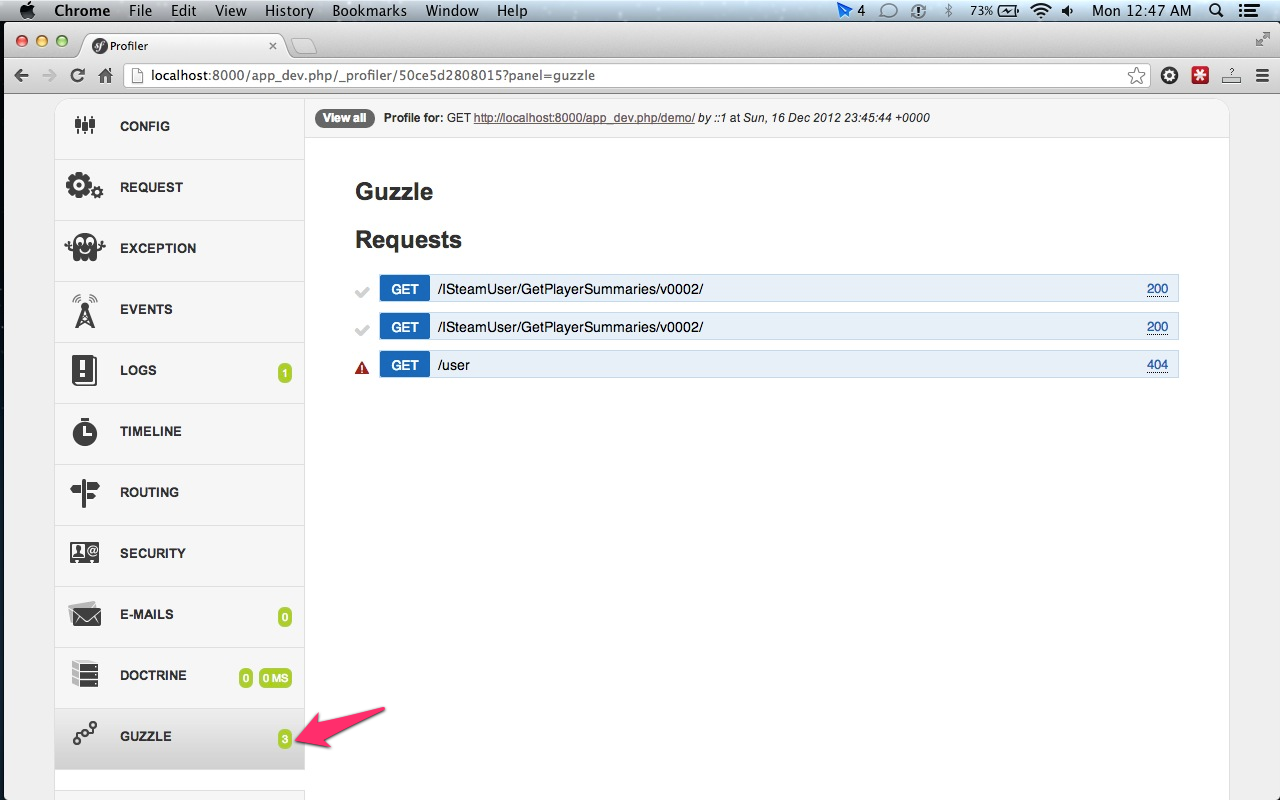
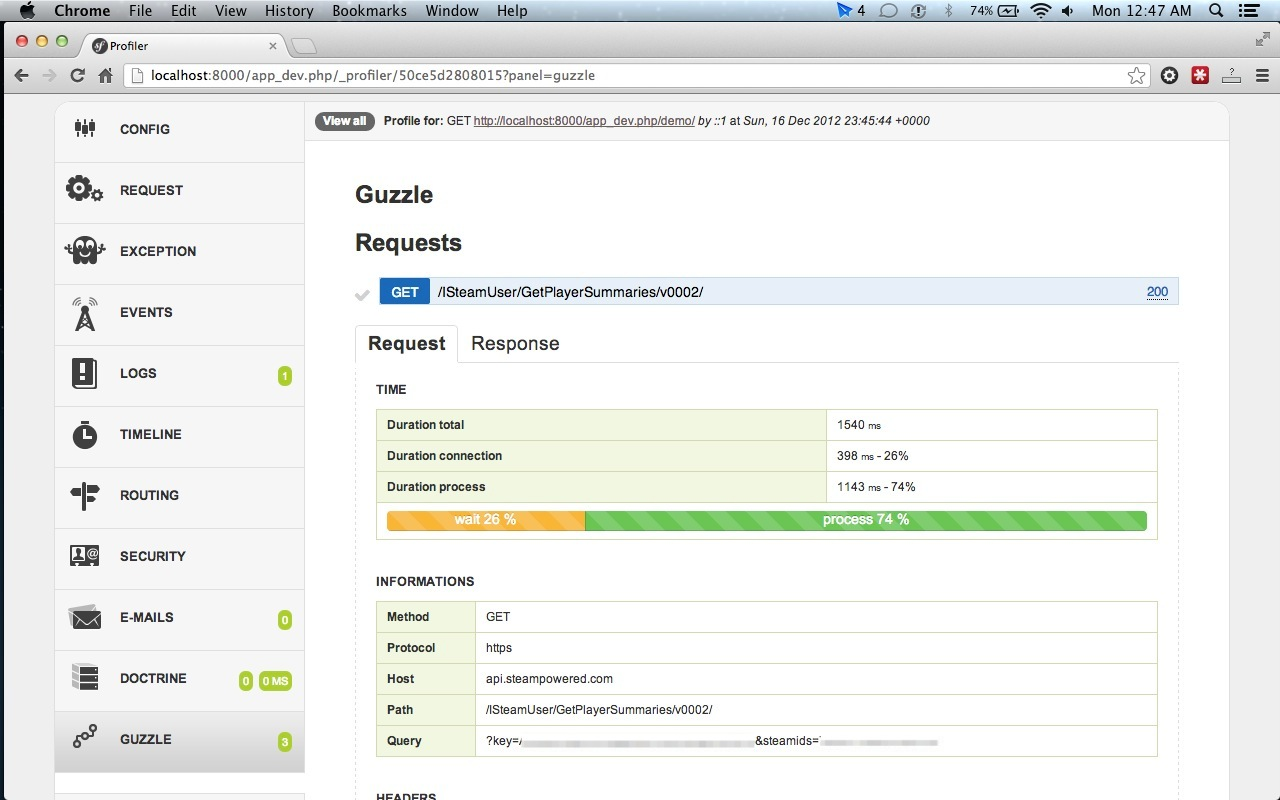
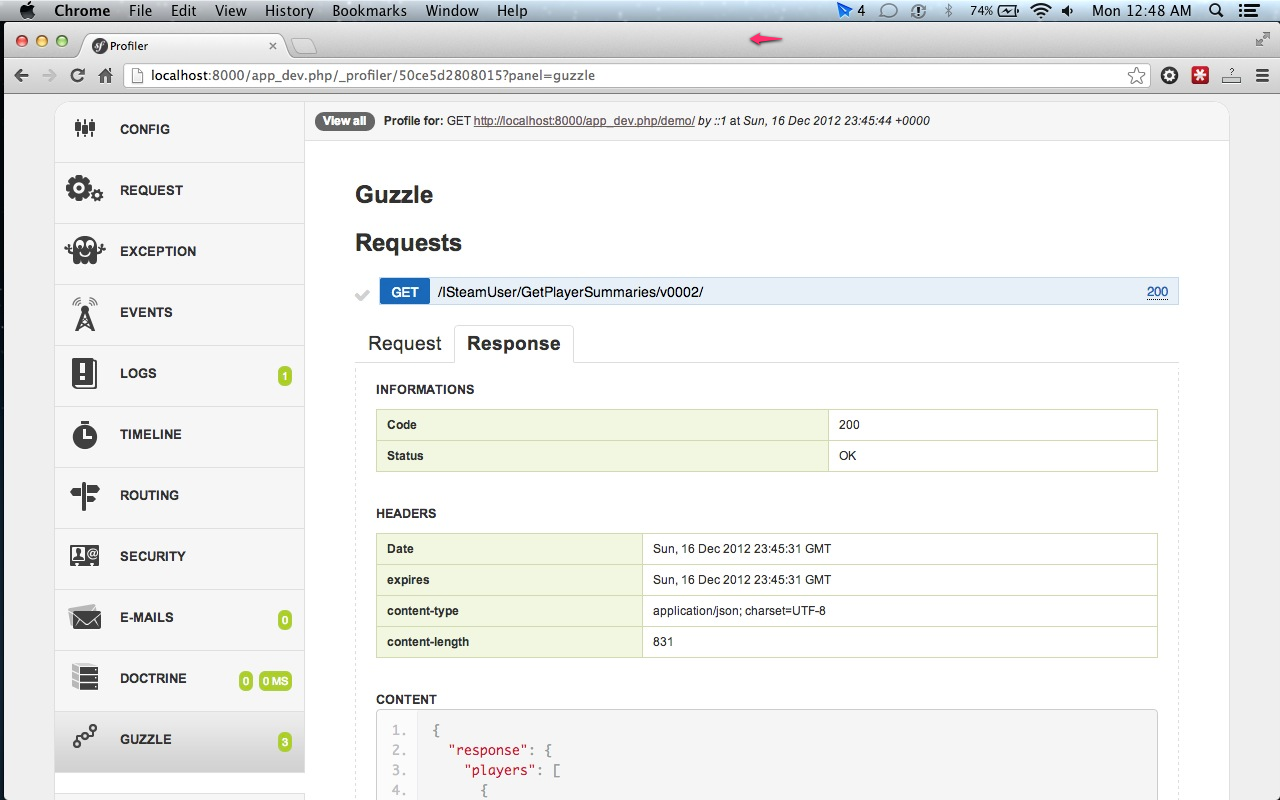
* The advanced profiler is for debug purposes and will display a dedicated report available in the toolbar and Symfony Web Profiler
## Installation
Add the composer requirements
```javascript
{
"require-dev": {
"playbloom/guzzle-bundle": "v1.1.0"
},
}
```
Add the bundle to your Symfony app kernel
```php
```
To enable the advanced profiler & the toolbar/web profiler panel, add this line to your `app/config/config_dev.yml`
```yml
playbloom_guzzle:
web_profiler: true
```
### Guzzle client as a Symfony service
Concrete [Guzzle client creation](http://guzzle.readthedocs.org/en/latest/clients.html#creating-a-client) can be easily managed by the Symfony service container thanks to a [simple factory configuration](http://symfony.com/doc/current/components/dependency_injection/factories.html), in this case, you just need to tag your guzzle service(s) with `playbloom_guzzle.client`.
It will add the basic logger to your client(s). If the web_profiler is enabled in the current environement, it will also add the advanced profiler and display report on the Symfony toolbar/web profiler.
```xml
```
### Add the logger/profiler manually to a Guzzle client
If you need to handle the registration of the logger or profiler plugin manually, you can retrieve theses services from the Symfony container.
```php
get('playbloom_guzzle.client.plugin.logger');
$client->addSubscriber($loggerPlugin);
// advanced profiler for developement and debug, requires web_profiler to be enabled
$profilerPlugin = $container->get('playbloom_guzzle.client.plugin.profiler');
$client->addSubscriber($profilerPlugin);
?>
```
## Customize your own profiler panel
If you need a [custom profiler panel](http://symfony.com/doc/master/cookbook/profiler/data_collector.html) you can extend/reuse easily the data collector and profiler template from this bundle.
For example, you have a GithubBundle which interact with the Github API. You also have a Github profiler panel to debug your developement and you want to have the API requests profiled in this panel.
It's quite easy:
First, define your own `GithubDataCollector` extending the `Playbloom\Bundle\GuzzleBundle\DataCollector\GuzzleDataCollector`
Then extends the guzzle web profiler template
```twig
{% extends 'PlaybloomGuzzleBundle:Collector:guzzle.html.twig' %}
{% block panel %}
Github
-
Github API key: {{ collector.getApiKey }}
{% include 'PlaybloomGuzzleBundle:Profiler:requests.html.twig' with {'requests': collector.requests } %}
{% endblock %}
```
And finally declare your data collector
```xml
```
That's it, now your profiler panel displays your custom information and the Guzzle API requests.
## TODO
* Add extra information about the client configuration itself (thanks to the guzzle service builder?)
* Add clients|host|endpoint|time filters for http requests
## Licence
This bundle is under the MIT license. See the complete license in the bundle
## Credits
* Swagger for the UI
[](https://bitdeli.com/free "Bitdeli Badge")