Ecosyste.ms: Awesome
An open API service indexing awesome lists of open source software.
https://github.com/lukaspustina/usereport-rs
Collect system information for the first 60 seconds of a performance analysis
https://github.com/lukaspustina/usereport-rs
analysis cli performance sre statistics
Last synced: 2 months ago
JSON representation
Collect system information for the first 60 seconds of a performance analysis
- Host: GitHub
- URL: https://github.com/lukaspustina/usereport-rs
- Owner: lukaspustina
- License: mit
- Created: 2019-12-20T12:55:51.000Z (about 5 years ago)
- Default Branch: master
- Last Pushed: 2020-02-26T12:34:09.000Z (almost 5 years ago)
- Last Synced: 2024-11-21T11:12:12.528Z (3 months ago)
- Topics: analysis, cli, performance, sre, statistics
- Language: Rust
- Homepage:
- Size: 1.16 MB
- Stars: 2
- Watchers: 2
- Forks: 0
- Open Issues: 0
-
Metadata Files:
- Readme: README.md
- License: LICENSE
Awesome Lists containing this project
README
# USE-Report
[](https://dev.azure.com/lukaspustina/usereport-rs/_build/latest?definitionId=3&branchName=master) [](https://crates.io/crates/usereport-rs) [](https://docs.rs/crate/usereport-rs/) [](./LICENSE)
`usereport` gathers system performance statistics on the local host that may be used as the base information for a performance analysis following the [USE methodology](http://www.brendangregg.com/usemethod.html) created by Brendan Gregg. Please see [this blog post](http://techblog.netflix.com/2015/11/linux-performance-analysis-in-60s.html) by Brendan for an introduction to USE and the statistics gathered by this tool. The `usereport` tool is part of my base server installation. I use it everywhere. It allows me to quickly assess several system characteristics in case of performance issues.
`usereport` comes with bundled configuration files for Linux and macOS, respectively, that are built into the corresponding binary. The configuration files contain a pre-defined selection of performance measurement and analysis tools. Please see the `contrib` directory for these configuration tools. In case of Linux, several profiles allow for statistics gathering depending on the context of your analysis, i.e., `mem` for virtual memory and `net` for network issues. With `usereport` you do not need to remember the exact tools and their parameters to conduct a performance analysis. Furthermore, each tool configuration contains descriptions of the output to ease interpretation of results, e.g., meaning and metrics of the gathered values, as well as links to further information.
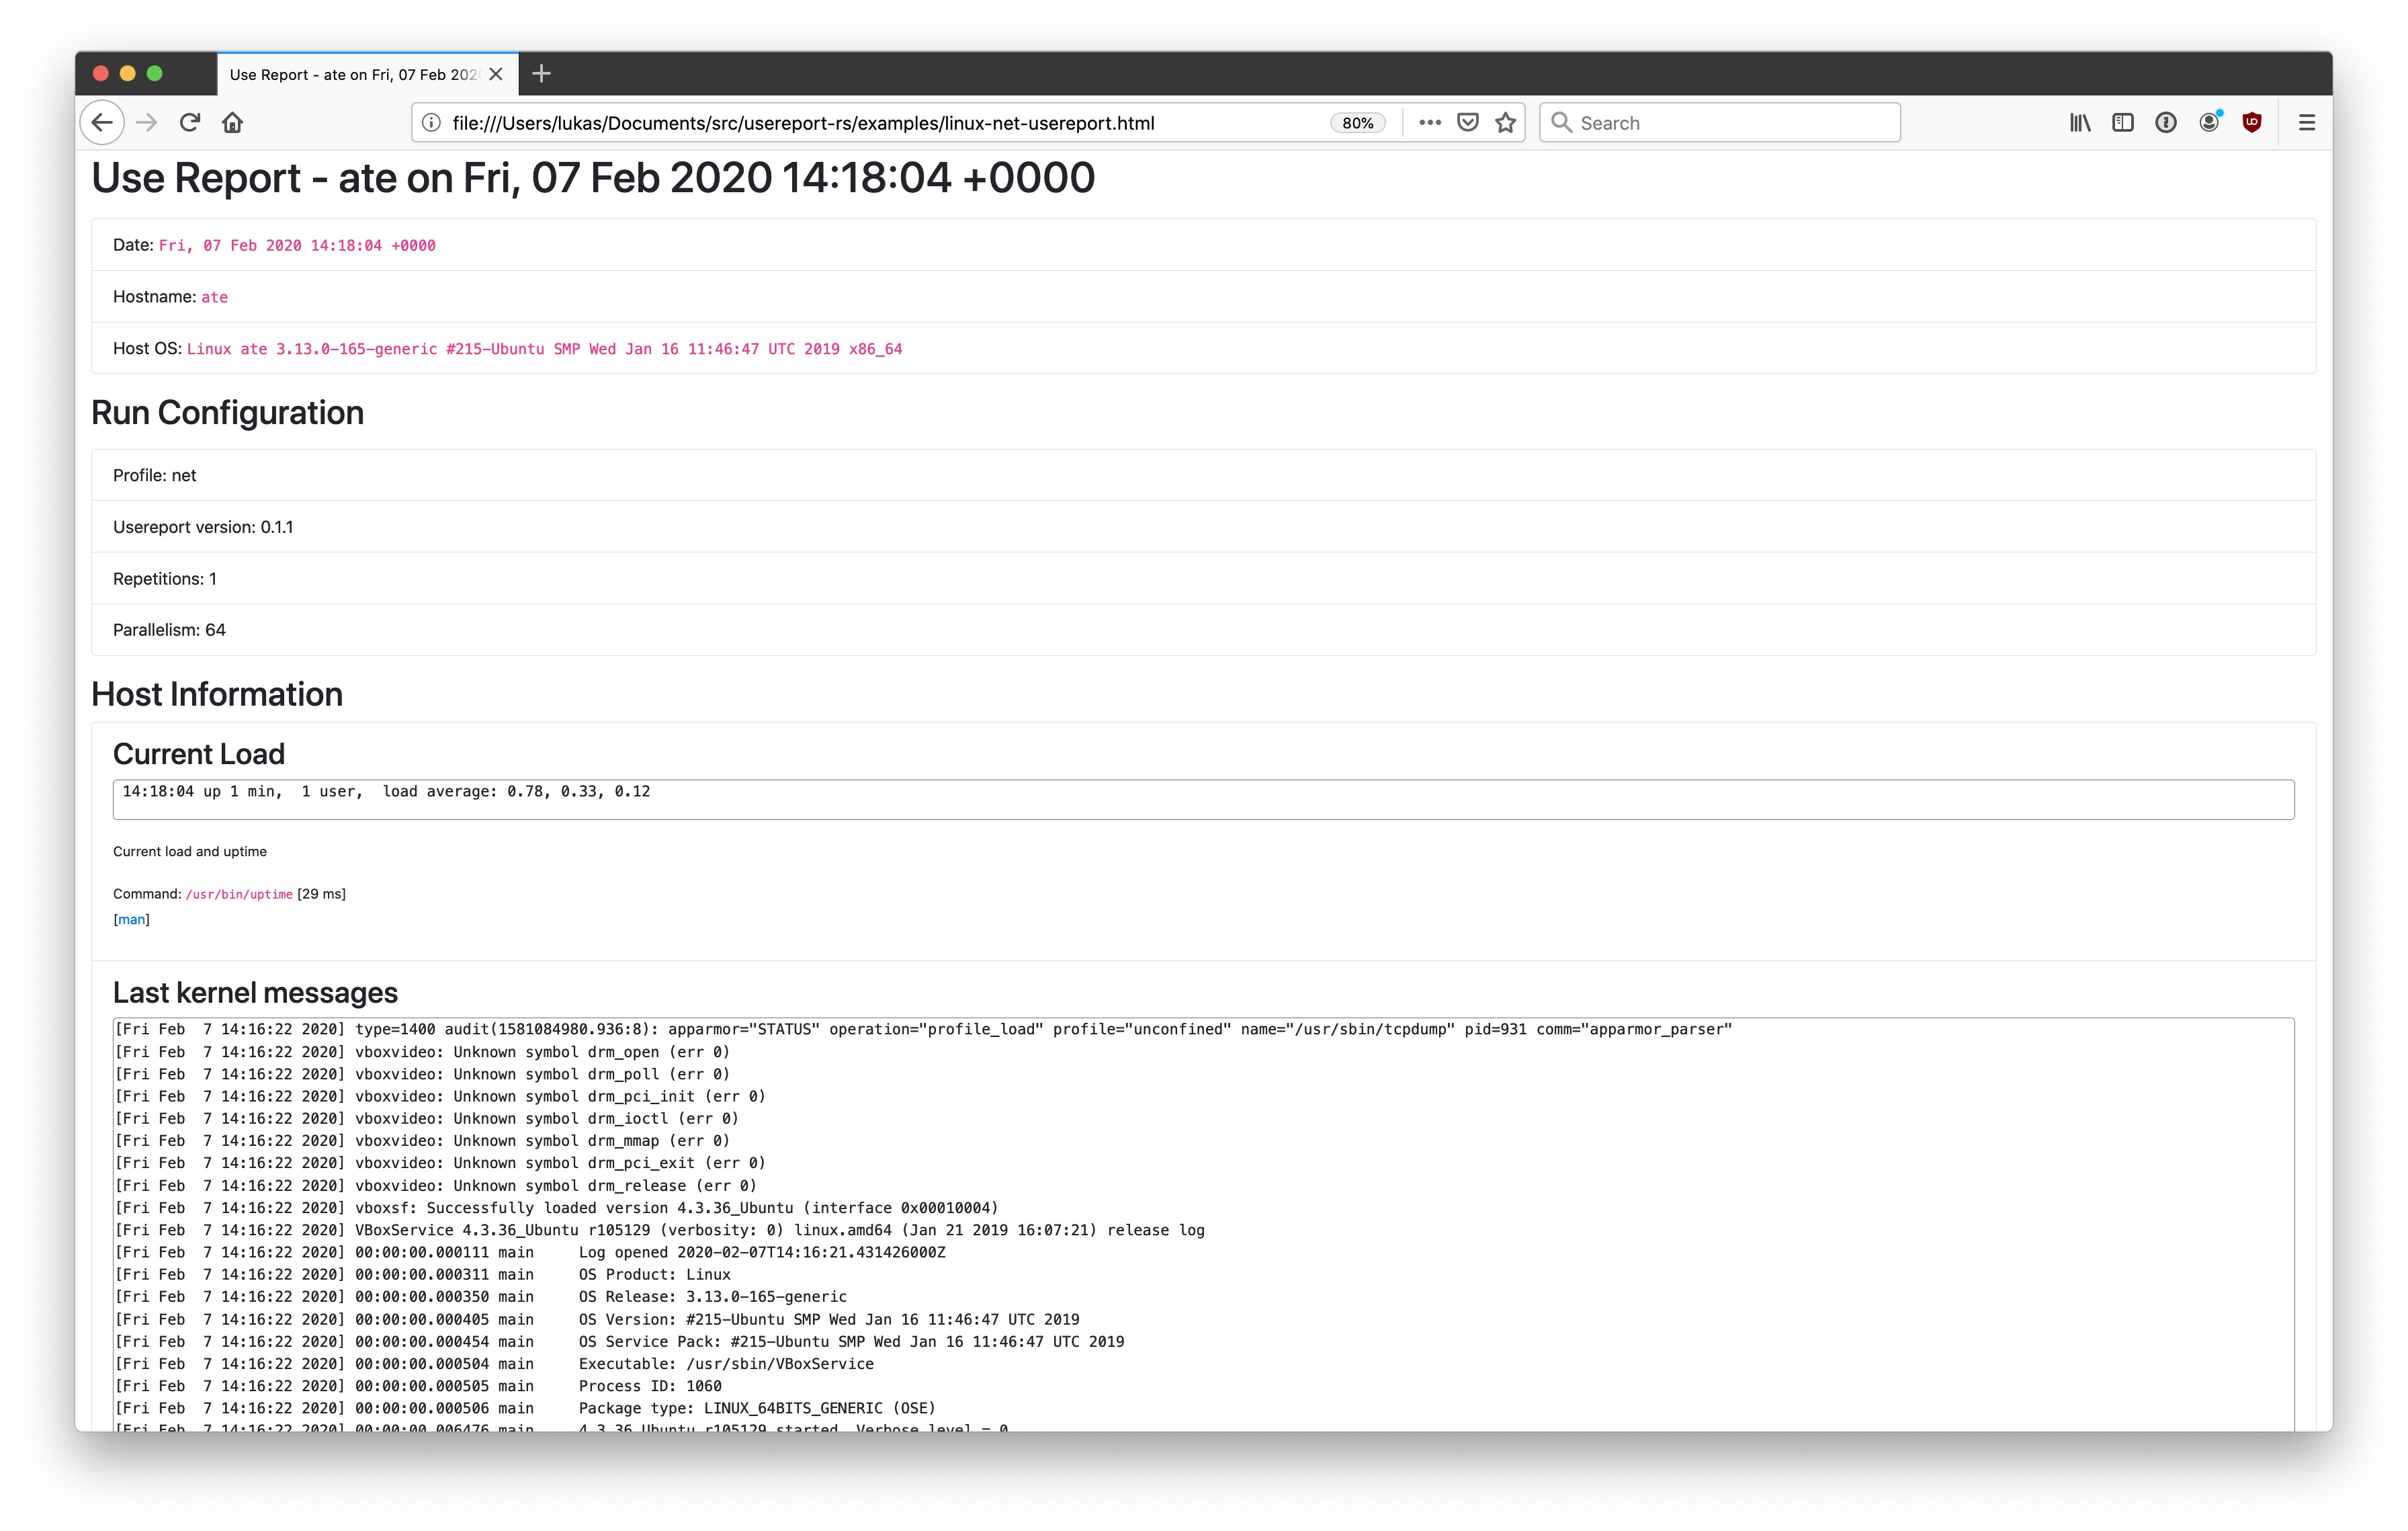
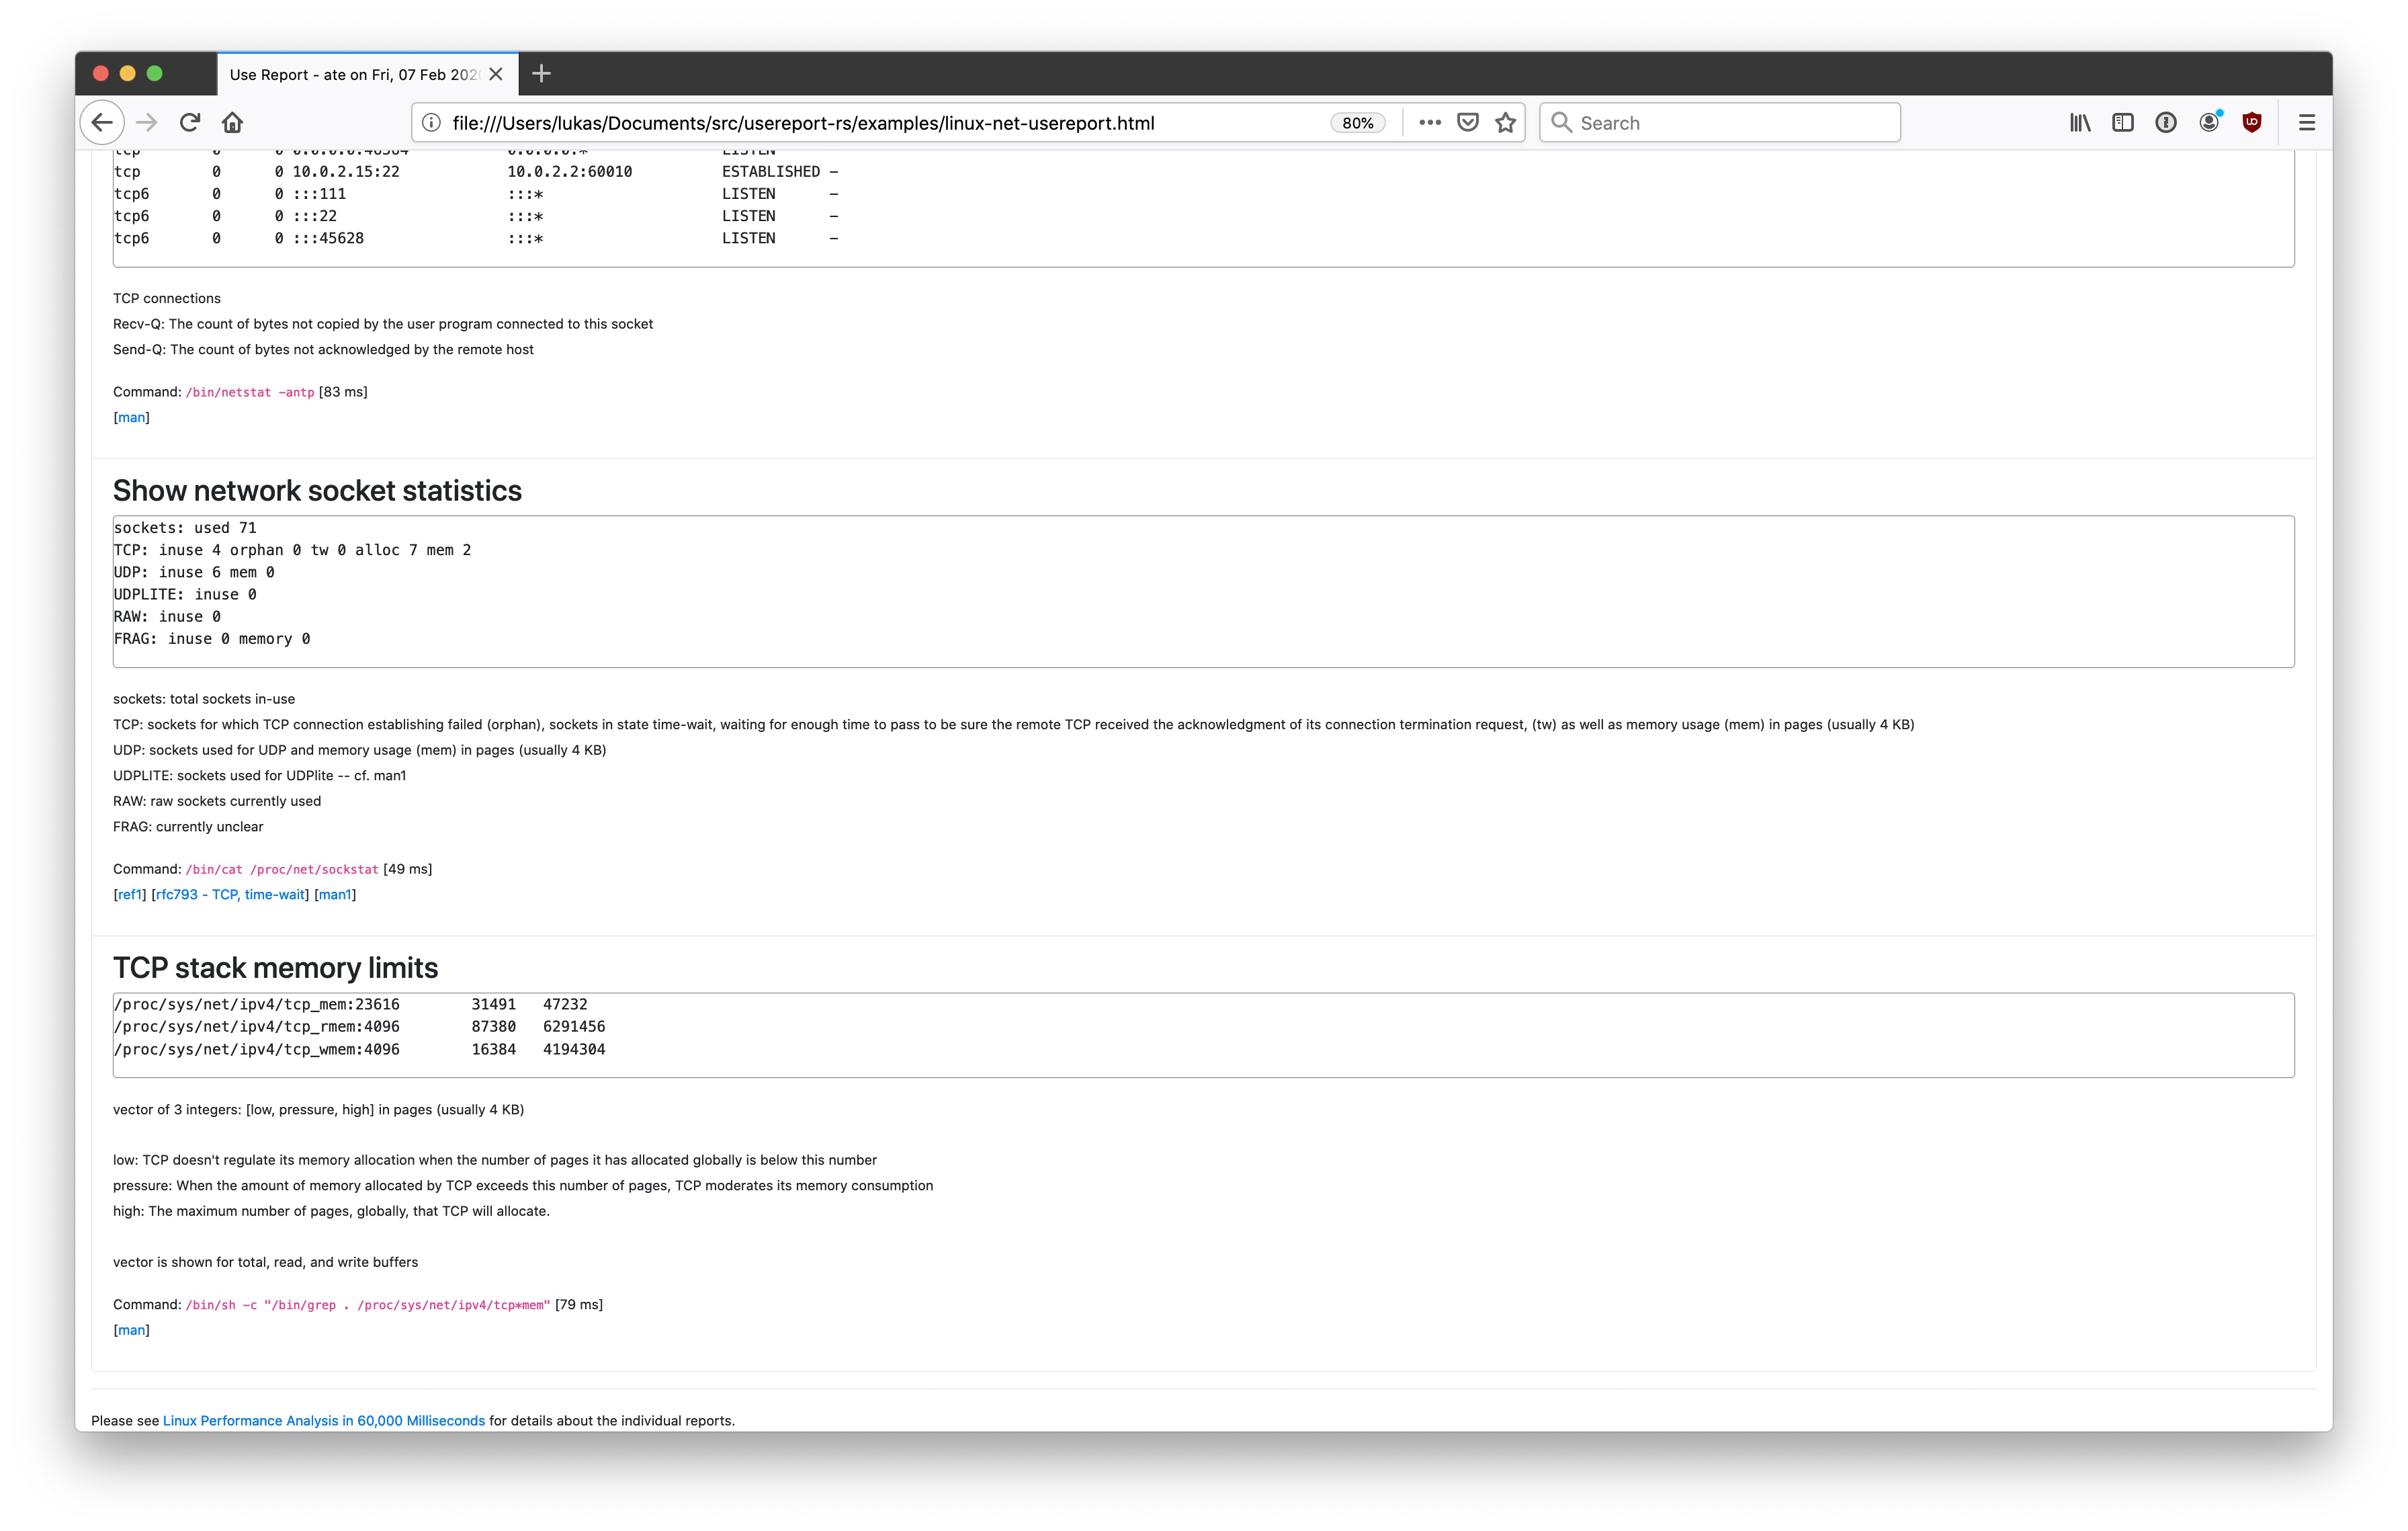
The output format of `usereport` is usually Markdown or HTML for convenient reading. JSON output is also available for automatic processing, or you can define your own output format using [Handlebars templates](https://handlebarsjs.com). The following screenshots present parts of the HTML output created by `usereport` running the `net` profile performance analysis on Linux -- see the full report [here](https://htmlpreview.github.io/?https://github.com/lukaspustina/usereport-rs/blob/master/docs/linux-net-usereport.html).


The main functionality is exposed as a Rust library to be used in your own projects at your convenience.
## Command Line Tool
### Help
```sh
usereport 0.1.2
Lukas Pustina
Collect system information for the first 60 seconds of a performance analysis
USAGE:
usereport [FLAGS] [OPTIONS] [+|-command]...
FLAGS:
-d, --debug Activate debug mode
-h, --help Prints help information
--no-progress Force to hide progress bar while waiting for all commands to finish
--progress Force to show progress bar while waiting for all commands to finish
--show-commands Show available commands
--show-config Show active config
--show-output-template Show active template
--show-profiles Show available profiles
-V, --version Prints version information
OPTIONS:
-c, --config Configuration from file, or default if not present
-o, --output Output format [default: markdown] [possible values: hbs,
html, json, markdown]
--output-template Set output template if output is set to "hbs"
--parallel Set number of commands to run in parallel; overrides setting from config
file
-p, --profile Set profile to use
--repetitions Set number of how many times to run commands in row; overrides setting
from config file
ARGS:
<+|-command>... Add or remove commands from selected profile by prefixing the command's name with '+' or '-',
respectively, e.g., +uname -dmesg; you may need to use '--' to signify the end of the options
```
### Example on Linux
```sh
usereport --profile mem --progress --repetitions 3 --output html -- +mpstat
```
## Installation
### Ubuntu Bionic [x86_64]
Please add my [PackageCloud](https://packagecloud.io/lukaspustina/opensource) open source repository and install _usereport_ via apt.
```sh
curl -s https://packagecloud.io/install/repositories/lukaspustina/opensource/script.deb.sh | sudo bash
sudo apt-get install usereport
```
### Linux Binaries [x86_64]
There are binaries available at the GitHub [Release Page](https://github.com/lukaspustina/usereport-rs/releases). The binaries get compiled on Ubuntu Bionic.
### From Source
Please install Rust via [rustup](https://www.rustup.rs) and then run
```sh
cargo install --all-features usereport-rs
```
## Postcardware
You're free to use `usereport`. If you find it useful, I would highly appreciate you sending me a postcard from your hometown mentioning how you use `usereport`. My work address is
```
Lukas Pustina
CenterDevice GmbH
Rheinwerkallee 3
53227 Bonn
Germany
```
## Contributing
I'll be happy about suggestions and pull requests.