https://github.com/lupyuen/ingest-nuttx-builds
Ingest Build Logs from Apache NuttX RTOS into Prometheus Pushgateway
https://github.com/lupyuen/ingest-nuttx-builds
ci nuttx prometheus pushgateway
Last synced: 5 months ago
JSON representation
Ingest Build Logs from Apache NuttX RTOS into Prometheus Pushgateway
- Host: GitHub
- URL: https://github.com/lupyuen/ingest-nuttx-builds
- Owner: lupyuen
- License: apache-2.0
- Created: 2024-10-30T00:41:41.000Z (over 1 year ago)
- Default Branch: main
- Last Pushed: 2026-01-27T08:43:53.000Z (6 months ago)
- Last Synced: 2026-01-27T20:59:19.669Z (6 months ago)
- Topics: ci, nuttx, prometheus, pushgateway
- Language: Rust
- Homepage: https://lupyuen.org/articles/ci4.html
- Size: 175 KB
- Stars: 0
- Watchers: 1
- Forks: 0
- Open Issues: 1
-
Metadata Files:
- Readme: README.md
- Changelog: history.json
- Funding: .github/FUNDING.yml
- License: LICENSE
Awesome Lists containing this project
README
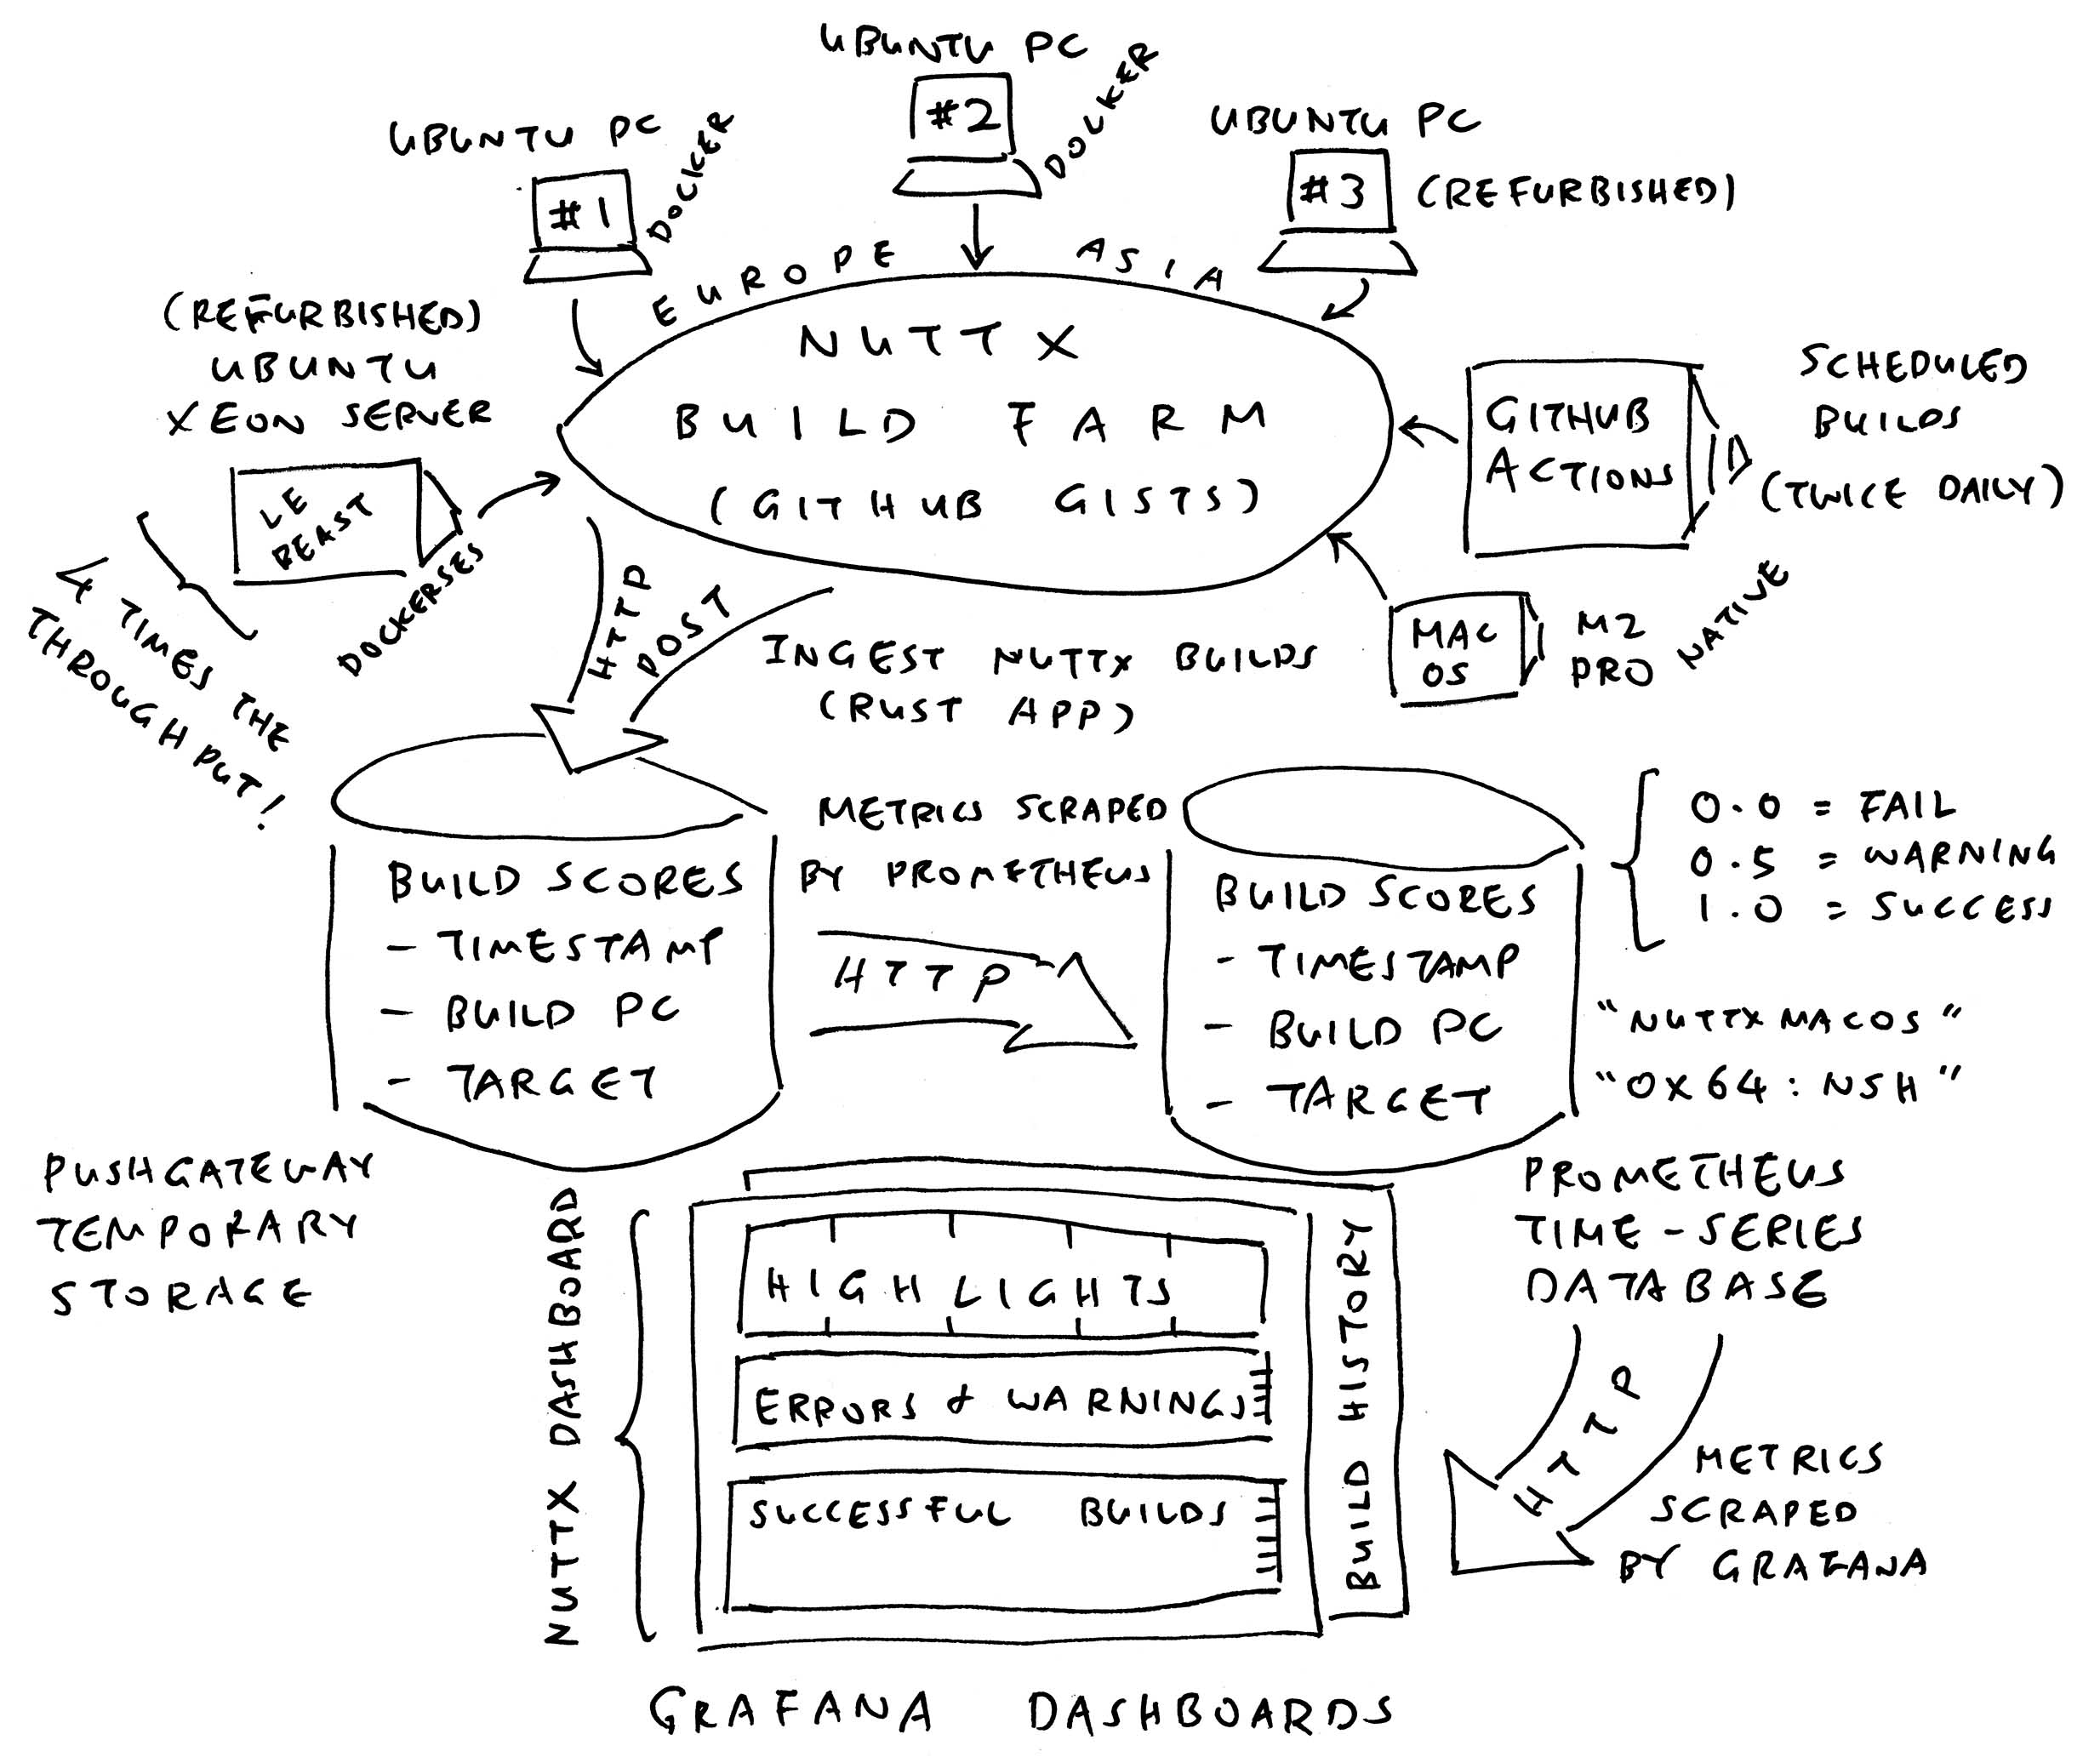
# Ingest Build Logs from Apache NuttX RTOS into Prometheus Pushgateway
Read the articles...
- ["Continuous Integration Dashboard for Apache NuttX RTOS (Prometheus and Grafana)"](https://lupyuen.org/articles/ci4.html)
- ["Optimising the Continuous Integration for Apache NuttX RTOS (GitHub Actions)"](https://lupyuen.org/articles/ci3.html)
- ["Your very own Build Farm for Apache NuttX RTOS"](https://lupyuen.org/articles/ci2.html)
- ["Rewinding a Build" for Apache NuttX RTOS (Docker)"](https://lupyuen.org/articles/ci6.html)
- ["Auto-Rewind for Daily Test (Apache NuttX RTOS)"](https://lupyuen.org/articles/rewind.html)
To ingest NuttX Build Logs into Prometheus Pushgateway: [run.sh](run.sh)
```bash
## We prefer GitLab Snippets, since GitHub Gists will get blocked for overuse.
## For GitHub Gists: Any GitHub Token with read access will do
## export GITHUB_TOKEN=...
. $HOME/github-token.sh
## Find all defconfig files
cd $HOME ; git clone https://github.com/apache/nuttx
find $HOME/nuttx -name defconfig >/tmp/defconfig.txt
## Ingest logs from lupyuen/nuttx-build-log GitLab Snippets. Remove special characters.
## gitlab-token.sh contains "export GITHUB_TOKEN=...", any GitLab Token with read access will do.
set +x ; . $HOME/gitlab-token.sh ; set -x
cargo run -- \
--user lupyuen \
--repo nuttx-build-log \
--defconfig /tmp/defconfig.txt \
| tr -d '\033\007'
unset GITLAB_TOKEN
## Ingest logs from nuttxpr GitHub Gist. Remove special characters.
cargo run -- \
--user nuttxpr \
--defconfig /tmp/defconfig.txt \
| tr -d '\033\007'
## Ingest logs from GitHub Actions
./github.sh
## Or: Start GitHub Actions Build, wait to complete then ingest logs
./build-github-and-ingest.sh
## Or: Sync NuttX Mirror Repo, start GitHub Actions Build, wait to complete then ingest logs
## https://github.com/lupyuen/nuttx-release/blob/main/sync-build-ingest.sh
../nuttx-release/sync-build-ingest.sh
```
[(See the __Ingest Log for GitHub Gists__)](https://gist.github.com/lupyuen/7da9c95b3efe39ff818772775c90da96)
[(See the __Ingest Log for GitHub Actions__)](https://gist.github.com/lupyuen/1c0c3ff584d083d59d4b2190ecee3f99)
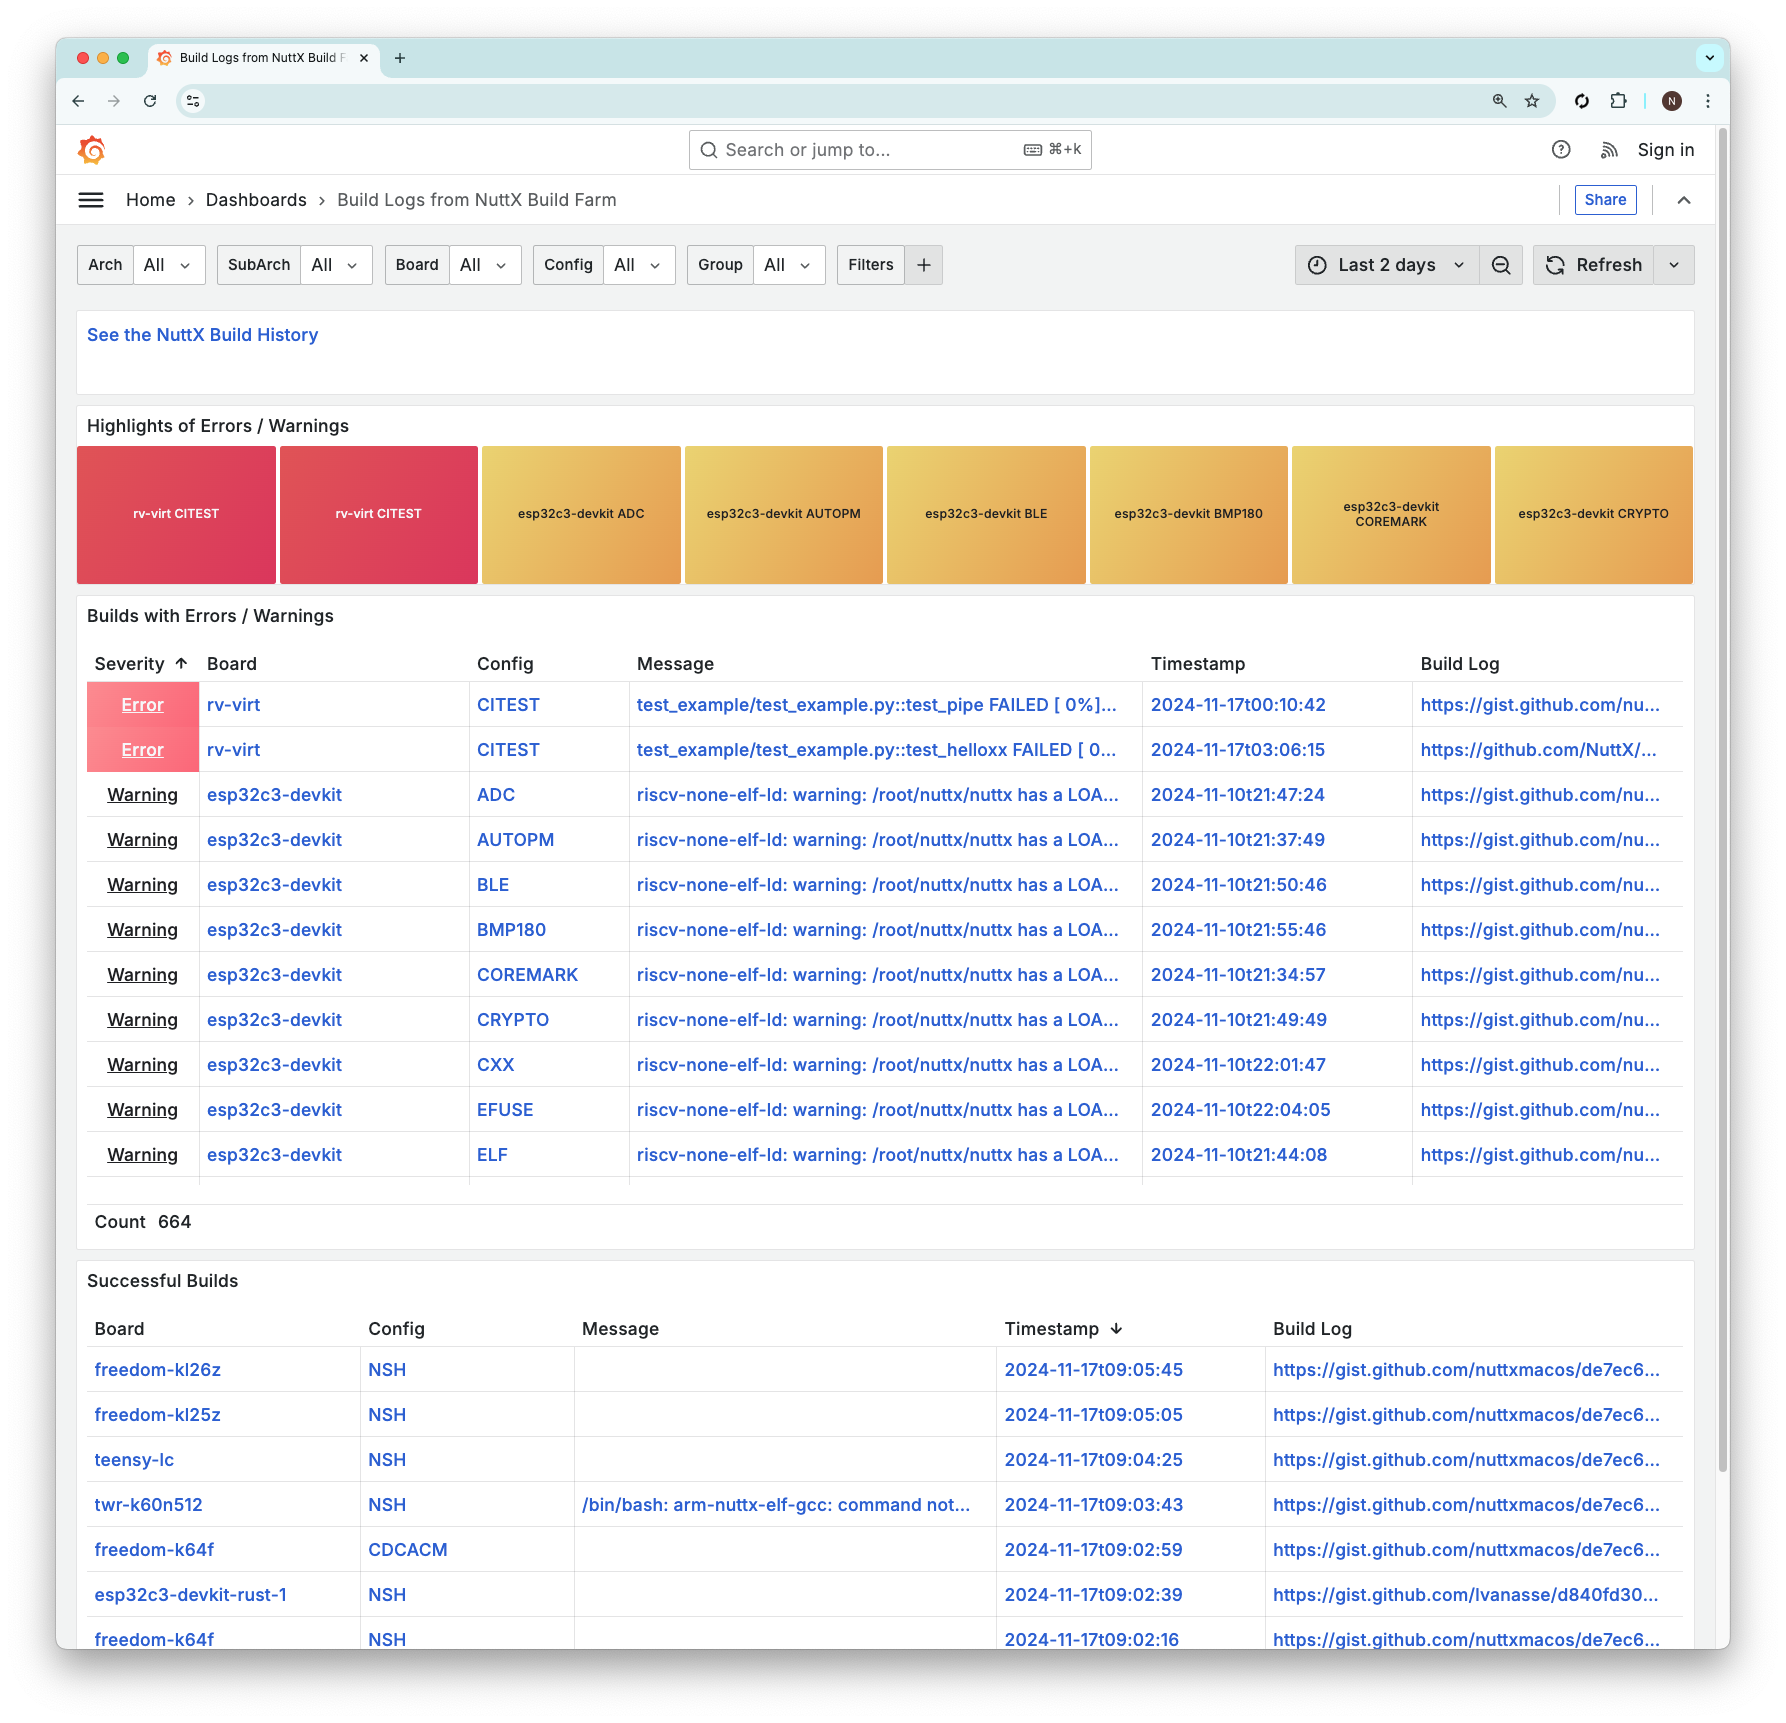
# Continuous Integration Dashboard
To install Grafana and Prometheus...
```bash
## Install Grafana
brew install grafana
brew services start grafana
## Browse to http://localhost:3000
## Install Prometheus
brew install prometheus
brew services start prometheus
## Browse to http://localhost:9090
## Install Prometheus Pushgateway
brew install go
git clone https://github.com/prometheus/pushgateway
cd pushgateway
go run main.go &
## Browse to http://localhost:9091
```
Update the Grafana and Prometheus Configuration...
- [/opt/homebrew/etc/grafana/grafana.ini](grafana.ini)
- [/opt/homebrew/etc/prometheus.yml](prometheus.yml)
Add the Grafana Dashboard and Panels...
- [dashboard.json](dashboard.json)
- [links.json](links.json)
- [highlights.json](highlights.json)
- [error-builds.json](error-builds.json)
- [success-builds.json](success-builds.json)
- [dashboard-history.json](dashboard-history.json)
- [history.json](history.json)
Remember to check for suspicious activity!
```bash
tail -f /opt/homebrew/var/log/grafana/grafana.log \
| grep --line-buffered "logger=context " \
| grep --line-buffered -v "path=/api/frontend-metrics " \
| grep --line-buffered -v "path=/api/live/ws " \
| grep --line-buffered -v "path=/api/plugins/grafana-lokiexplore-app/settings " \
| grep --line-buffered -v "path=/api/user/auth-tokens/rotate " \
| grep --line-buffered -v "path=/favicon.ico " \
| cut -d ' ' -f 9-15
```
Highlight the HTTP Errors: iTerm > Profile > Advanced > Triggers...
- Regular Expression: `status=[4-9][^ ]+[ ]`, Action: Highlight Line, Background: Red
- Regular Expression: `path=[^ ]+[ ]`, Action: Highlight Text, Background: Dark Blue
If we see too many HTTP 404 Errors for Dubious URLs (we're not a WordPress Server!): Turn on Cloudflare > Under Attack Mode. The errors should disappear.