https://github.com/lupyuen/prometheus-the-things-network
Prometheus Configuration for The Things Network (MQTT)
https://github.com/lupyuen/prometheus-the-things-network
grafana prometheus thethingsnetwork
Last synced: 9 months ago
JSON representation
Prometheus Configuration for The Things Network (MQTT)
- Host: GitHub
- URL: https://github.com/lupyuen/prometheus-the-things-network
- Owner: lupyuen
- License: apache-2.0
- Created: 2021-10-15T09:35:45.000Z (over 4 years ago)
- Default Branch: main
- Last Pushed: 2021-10-20T15:45:21.000Z (over 4 years ago)
- Last Synced: 2025-04-05T05:24:59.687Z (about 1 year ago)
- Topics: grafana, prometheus, thethingsnetwork
- Homepage: https://lupyuen.github.io/articles/prometheus
- Size: 20.5 KB
- Stars: 5
- Watchers: 3
- Forks: 2
- Open Issues: 0
-
Metadata Files:
- Readme: README.md
- License: LICENSE
Awesome Lists containing this project
README
# Prometheus and Grafana for The Things Network (MQTT)
Read the article...
- ["Monitor IoT Devices in The Things Network with Prometheus and Grafana"](https://lupyuen.github.io/articles/prometheus)
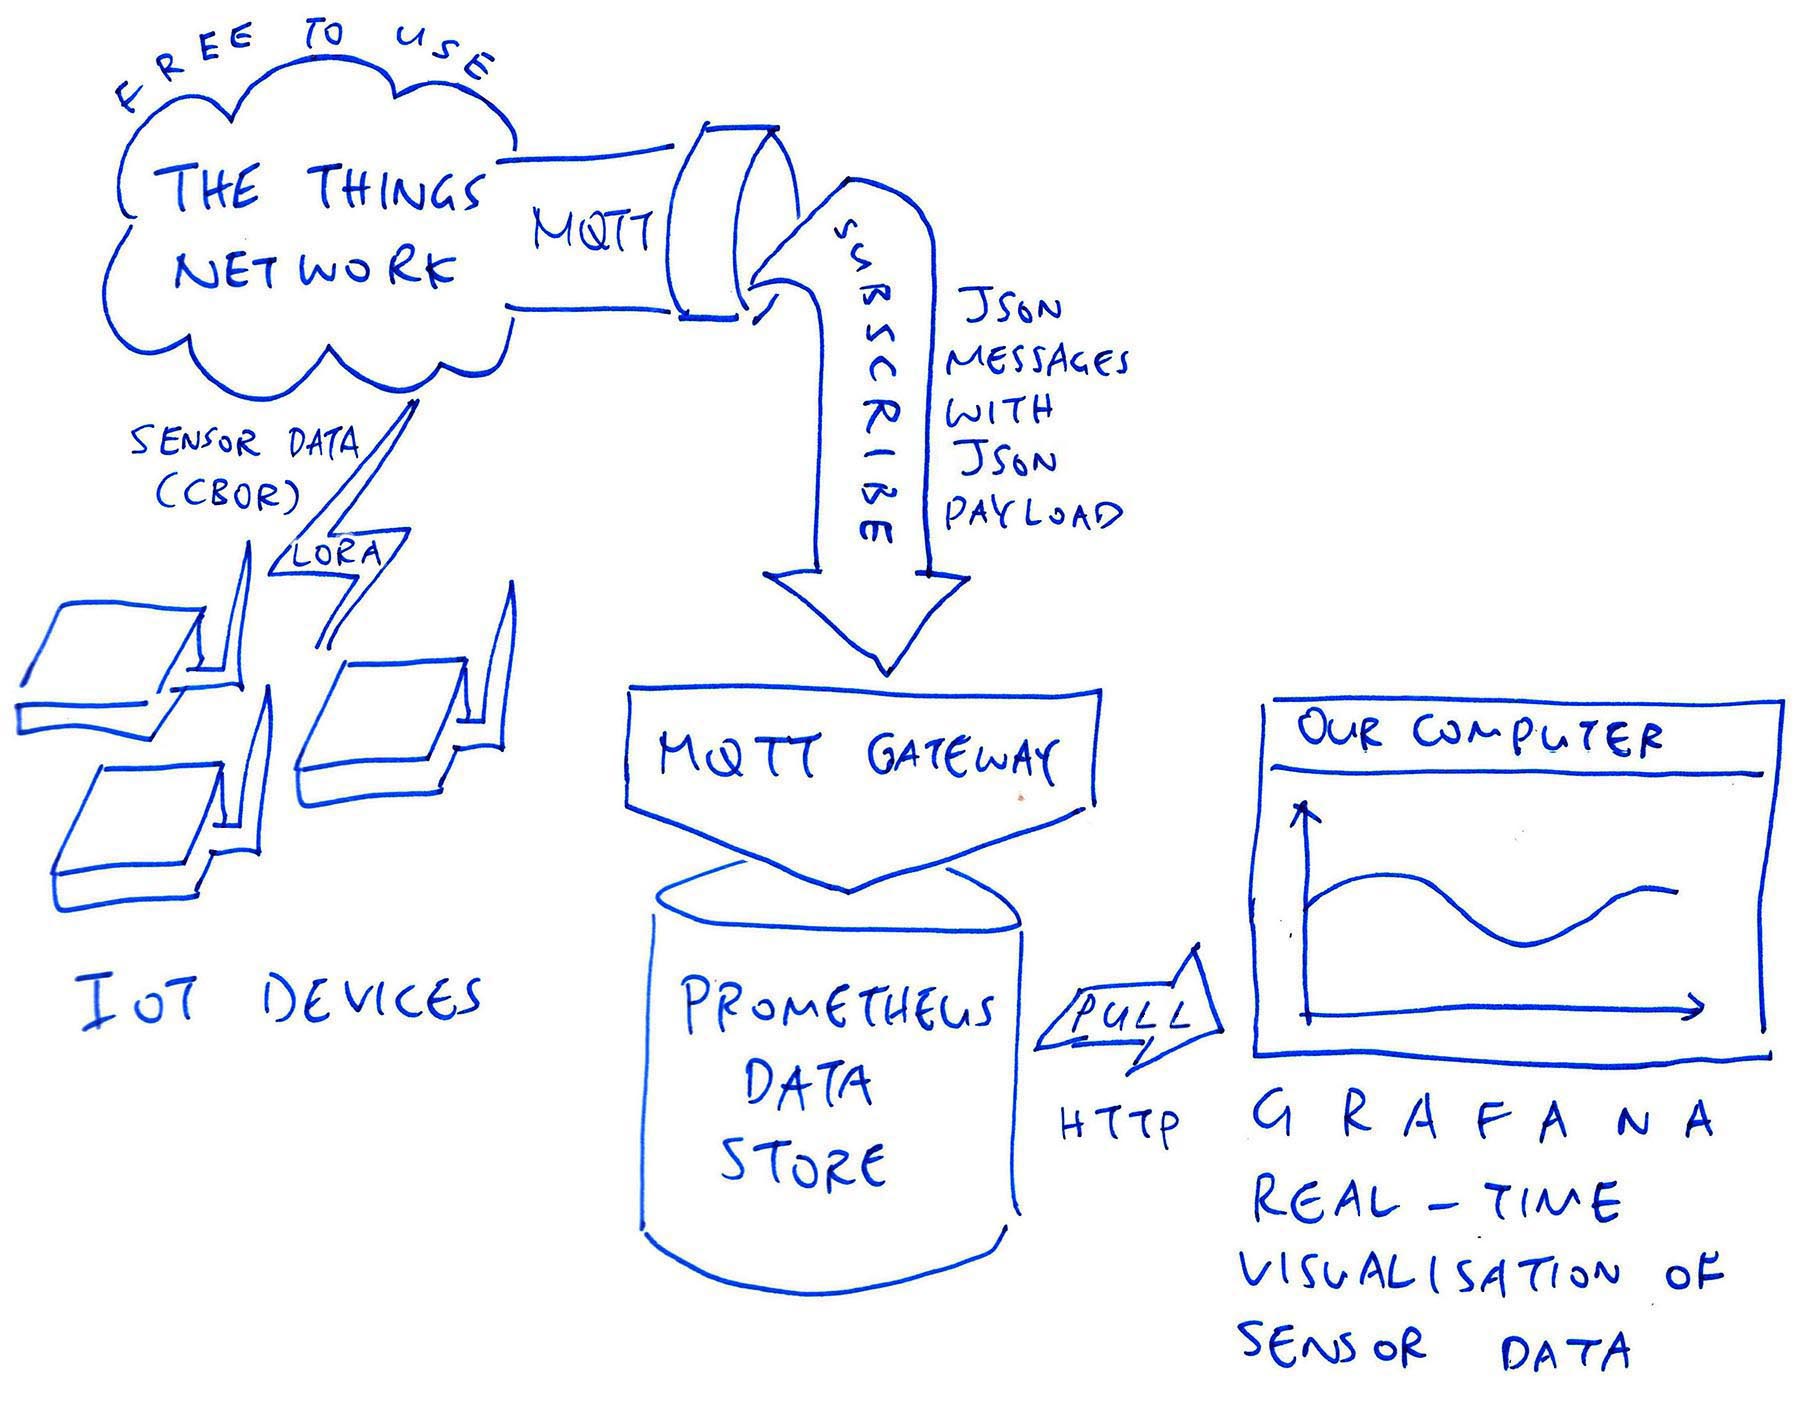
We assume that the Payload Formatter for The Things Network has been configured...
- ["CBOR Payload Formatter for The Things Network"](https://lupyuen.github.io/articles/payload)
# Ingest The Things Network MQTT Messages into Prometheus
To ingest MQTT Messages from The Things Network into Prometheus...
Download [`ttn-mqtt.yaml`](ttn-mqtt.yaml) and configure the MQTT Settings and Metrics.
Download and run `mqtt2prometheus`...
```bash
## Download mqtt2prometheus
go get github.com/hikhvar/mqtt2prometheus
## For macOS and Linux:
cd $GOPATH/src/github.com/hikhvar/mqtt2prometheus
## For Windows:
cd %GOPATH%\src\github.com\hikhvar\mqtt2prometheus
## Build mqtt2prometheus
go build ./cmd
## Run mqtt2prometheus
go run ./cmd -log-level debug -config ttn-mqtt.yaml
```
We should see...
```text
mqttclient/mqttClient.go:20
Connected to MQTT Broker
mqttclient/mqttClient.go:21
Will subscribe to topic{"topic": "#"}
web/tls_config.go:191
{"level": "info", "msg": "TLS is disabled.", "http2": false}
metrics/ingest.go:42
Got message
{"topic": "v3/luppy-application@ttn/devices/eui-YOUR_DEVICE_EUI/up", "payload":
{
"end_device_ids": {
"device_id": "eui-YOUR_DEVICE_EUI",
"application_ids": {
"application_id": "luppy-application"
},
"dev_eui": "YOUR_DEVICE_EUI",
"join_eui": "0000000000000000",
"dev_addr": "YOUR_DEVICE_ADDR"
},
"correlation_ids": [
"as:up:01FJ3TF5MHDHK9ZP17DJRCVNCC",
"gs:conn:01FJ36D90C9ETZFTFAB2N64JKM",
"gs:up:host:01FJ36D98KBG2AKNYWE24GAVCD",
"gs:uplink:01FJ3TF5DYDHZA5CY2YCXD05NG",
"ns:uplink:01FJ3TF5E0D1HYPBQRRE0DYBB6",
"rpc:/ttn.lorawan.v3.GsNs/HandleUplink:01FJ3TF5DZG9Q8RNF52TDP2TKX",
"rpc:/ttn.lorawan.v3.NsAs/HandleUplink:01FJ3TF5MGSAFH6ANWXJK8R520"
],
"received_at": "2021-10-16T05:51:19.698584300Z",
"uplink_message": {
"session_key_id": "YOUR_SESSION_KEY_ID",
"f_port": 2,
"f_cnt": 18,
"frm_payload": "omF0GROZYWwZD6A=",
"decoded_payload": {
"l": 4000,
"t": 5017
},
"rx_metadata": [
{
"gateway_ids": {
"gateway_id": "YOUR_GATEWAY_ID",
"eui": "YOUR_GATEWAY_EUI"
},
"time": "2021-10-16T05:58:01.085341Z",
"timestamp": 3854967529,
"rssi": -55,
"channel_rssi": -55,
"snr": 13.2,
"location": {
"latitude": 1.27125,
"longitude": 103.80795,
"altitude": 70,
"source": "SOURCE_REGISTRY"
},
"uplink_token": "YOUR_UPLINK_TOKEN",
"channel_index": 4
}
],
"settings": {
"data_rate": {
"lora": {
"bandwidth": 125000,
"spreading_factor": 10
}
},
"data_rate_index": 2,
"coding_rate": "4/5",
"frequency": "922600000",
"timestamp": 3854967529,
"time": "2021-10-16T05:58:01.085341Z"
},
"received_at": "2021-10-16T05:51:19.488029108Z",
"consumed_airtime": "0.370688s",
"network_ids": {
"net_id": "000013",
"tenant_id": "ttn",
"cluster_id": "ttn-au1"
}
}
}
}
```
To check the ingested metrics...
```bash
curl -v http://localhost:9641/metrics
```
We should see...
```text
# HELP l Light Level
# TYPE l gauge
l{sensor="eui-YOUR_DEVICE_EUI",
sensor_type="l",
topic="v3/luppy-application@ttn/devices/eui-YOUR_DEVICE_EUI/up"
} 4000 1634364863274
...
# HELP received_messages received messages per topic and status
# TYPE received_messages counter
received_messages{status="success",
topic="v3/luppy-application@ttn/devices/eui-YOUR_DEVICE_EUI/up"
} 3
...
# HELP t Temperature
# TYPE t gauge
t{sensor="eui-YOUR_DEVICE_EUI",
sensor_type="t",
topic="v3/luppy-application@ttn/devices/eui-YOUR_DEVICE_EUI/up"
} 5056 1634364863274
```
# Configure Prometheus
To add the ingested metrics to Prometheus, edit `prometheus.yml` and add a Scrape Job for `ttn`...
```yaml
# Scrape configuration containing the endpoints to scrape
scrape_configs:
...
# Scrape The Things Network Metrics from MQTT2Prometheus
- job_name: "ttn"
# Metrics will be scraped from MQTT2Prometheus
# at http://localhost:9641/metrics
static_configs:
- targets: ["localhost:9641"]
```
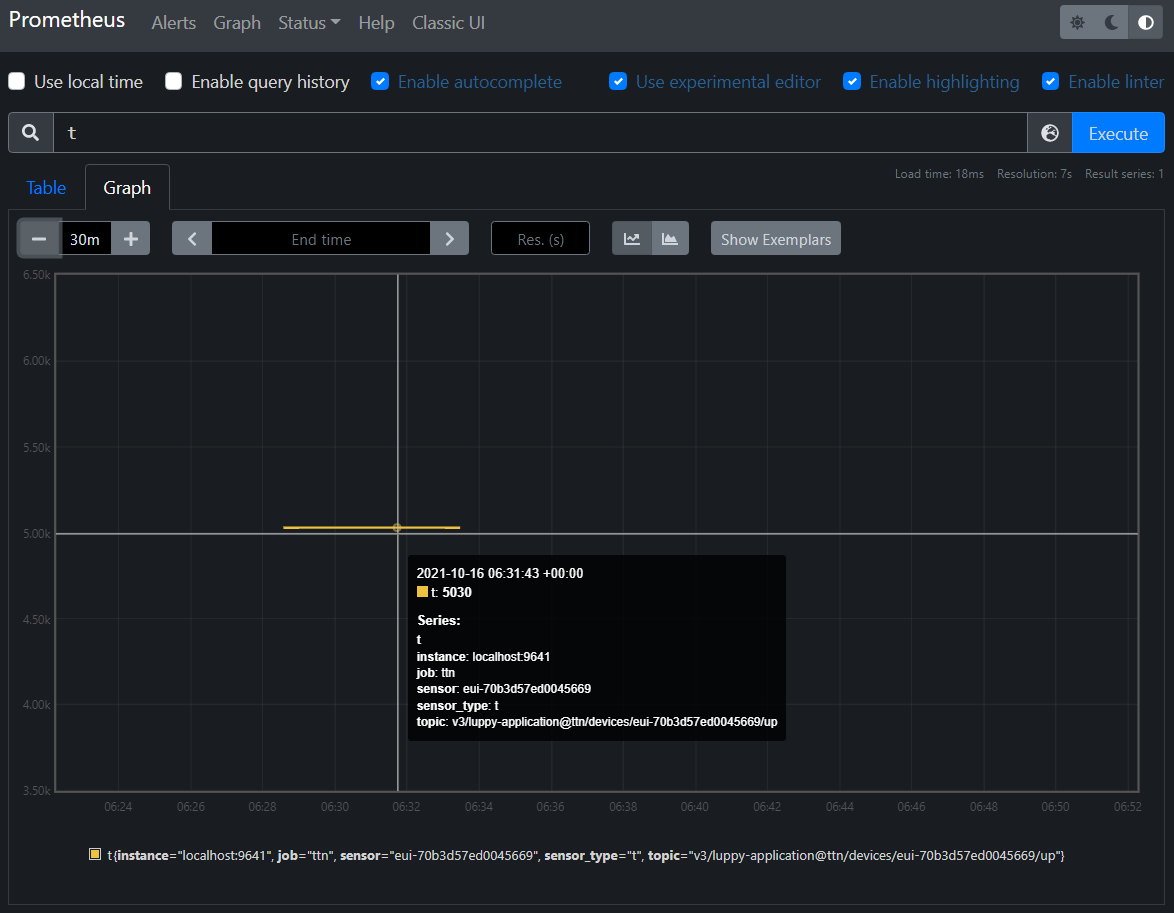
To see the ingested metrics in Prometheus, browse to...
http://localhost:9090/
In the query box enter...
```text
t
```
Or...
```text
l
```
Click `Execute → Graph`
We should see a graph of the Temperature or Light Level...
# Configure Grafana
To add the Prometheus metrics to Grafana, add a Prometheus Data Source with the URL...
```text
http://localhost:9090
```
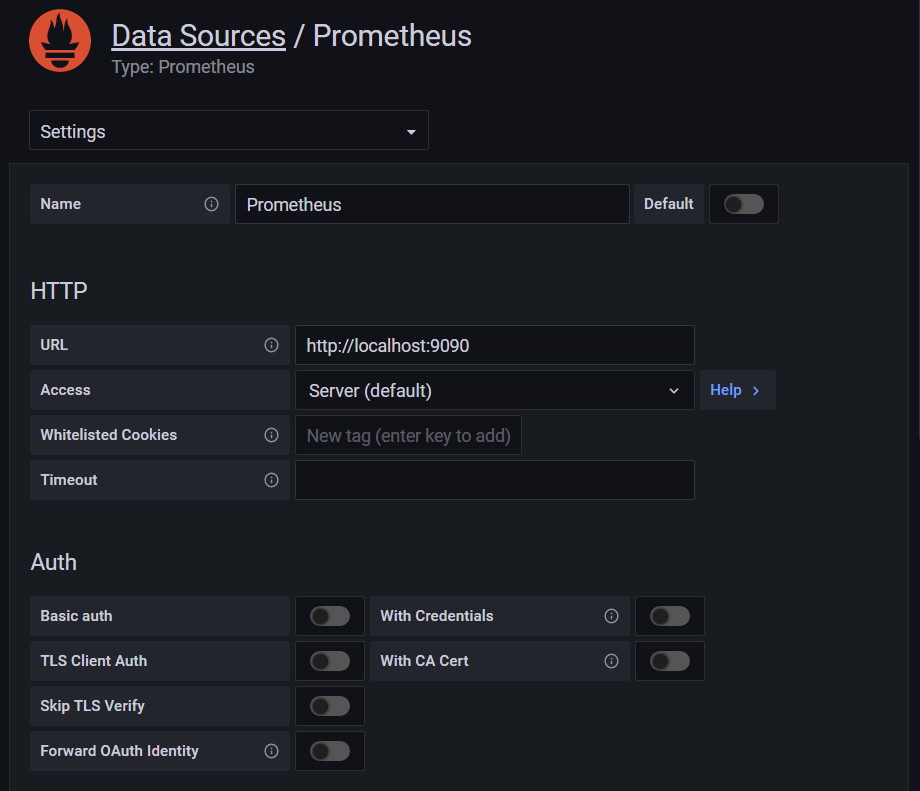
Add a Grafana Panel with the Prometheus Data Source.
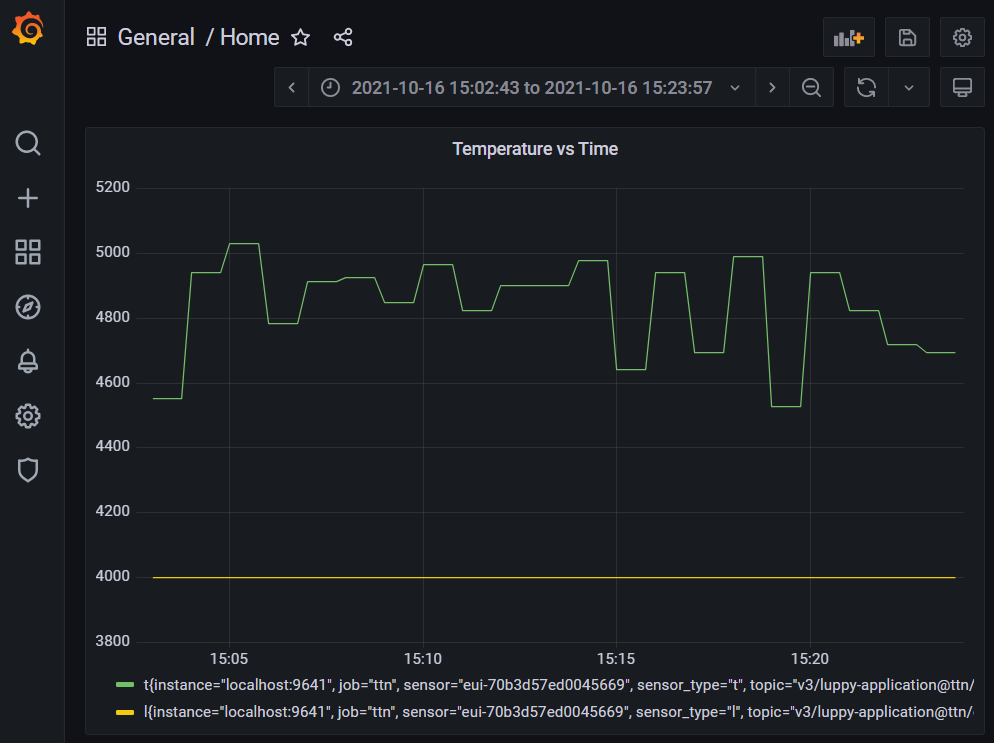
Set the Metric to `t` or `l`...
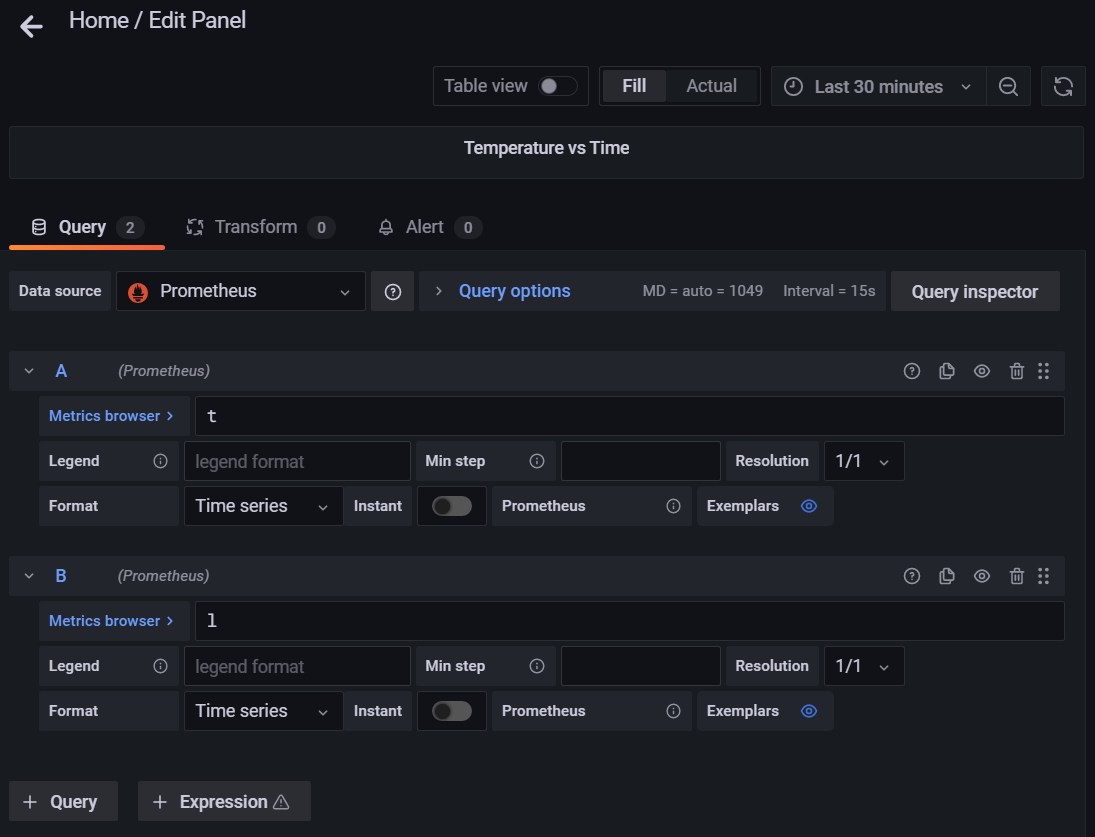
The Grafana chart appears...
# MQTT with TLS
To connect `mqtt2prometheus` to The Things Network MQTT Server with __TLS Encryption__ (so that the MQTT Password won't be transmitted in the clear)...
Edit this source file...
```text
$GOPATH/src/github.com/hikhvar/mqtt2prometheus/cmd/mqtt2prometheus.go
```
And modify the `newTLSConfig` function as follows...
```go
func newTLSConfig(cfg config.Config) (*tls.Config, error) {
certpool := x509.NewCertPool()
if cfg.MQTT.CACert != "" {
pemCerts, err := ioutil.ReadFile(cfg.MQTT.CACert)
if err != nil {
return nil, fmt.Errorf("failed to load ca_cert file: %w", err)
}
certpool.AppendCertsFromPEM(pemCerts)
}
// Added this for debugging
fmt.Printf("%#v\n", certpool)
// We don't need to load the Client Cert
// cert, err := tls.LoadX509KeyPair(cfg.MQTT.ClientCert, cfg.MQTT.ClientKey)
// if err != nil {
// return nil, fmt.Errorf("failed to load client certificate: %w", err)
// }
// cert.Leaf, err = x509.ParseCertificate(cert.Certificate[0])
// if err != nil {
// return nil, fmt.Errorf("failed to parse client certificate: %w", err)
// }
return &tls.Config{
RootCAs: certpool,
InsecureSkipVerify: false,
// We don't need to load the Client Cert
// Certificates: []tls.Certificate{cert},
}, nil
}
```
Edit [`ttn-mqtt.yaml`](ttn-mqtt.yaml) and configure MQTT as follows...
```yaml
## Change au1.cloud.thethings.network to our MQTT Public Address
## Use ssl://... instead of tcp://...
## Port number is 8883 instead of 1883
server: ssl://au1.cloud.thethings.network:8883
## For TLS CA Certificate
ca_cert: ttn.cer
client_cert: certs/xxxxx-certificate.pem.crt
client_key: certs/xxxxx-private.pem.key
```
`client_cert` and `client_key` won't be used, but they must be uncommented.
To get `ttn.cer`: Browse to your Region-Specific URL for The Things Network, like...
```text
https://au1.cloud.thethings.network
```
In the URL Bar, click...
Lock Icon → Connection Is Secure → Certificate Is Valid → Details → Copy To File → Base64 CER
Enter `ttn.cer` as the filename.
Restart `mqtt2prometheus`.
We should see...
```text
&x509.CertPool{byName:map[string][]int{"0&1$0\"\x06\x03U\x04\x03\x13\x1bau1.cloud.thethings.network":[]int{0}}, lazyCerts:[]x509.lazyCert{x509.lazyCert{rawSubject:[]uint8{0x30, 0x26, 0x31, 0x24, 0x30, 0x22, 0x6, 0x3, 0x55, 0x4, 0x3, 0x13, 0x1b, 0x61, 0x75, 0x31, 0x2e, 0x63, 0x6c, 0x6f, 0x75, 0x64, 0x2e, 0x74, 0x68, 0x65, 0x74, 0x68, 0x69, 0x6e, 0x67, 0x73, 0x2e, 0x6e, 0x65, 0x74, 0x77, 0x6f, 0x72, 0x6b}, getCert:(func() (*x509.Certificate, error))(0x109da20)}}, haveSum:map[x509.sum224]bool{x509.sum224{0x4, 0xc3, 0x5, 0xf6, 0x3f, 0x5b, 0x23, 0xe3, 0xfb, 0xf9, 0x78, 0xd2, 0x49, 0xb4, 0xda, 0xa1, 0x75, 0x13, 0xe4, 0x2b, 0xf4, 0x7c, 0x97, 0x71, 0xf3, 0x67, 0x0, 0xa9}:true}}
mqttclient/mqttClient.go:20
Connected to MQTT Broker
web/tls_config.go:191
{"level": "info", "msg": "TLS is disabled.", "http2": false}
mqttclient/mqttClient.go:21
Will subscribe to topic {"topic": "#"}
```
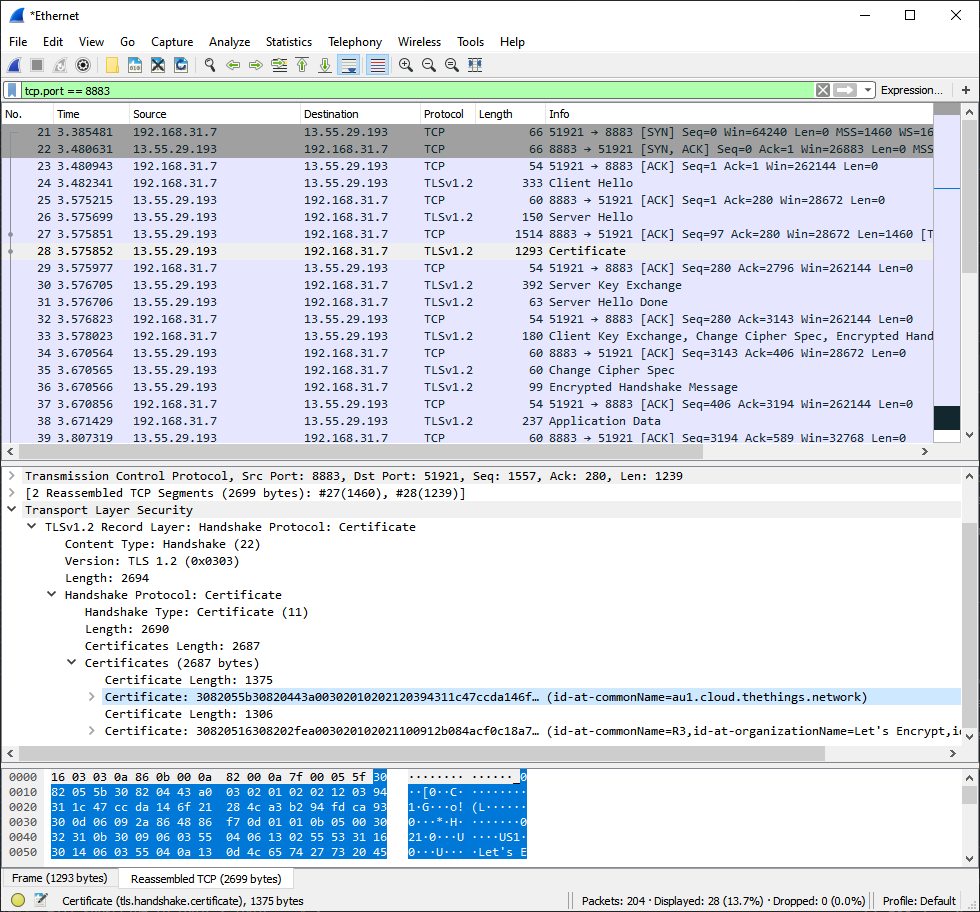
In case of problems, use WireShark to troubleshoot the TLS connection...