https://github.com/m-kovalsky/ReportAnalyzer
A tool for visualizing and analyzing a Power BI report's performance.
https://github.com/m-kovalsky/ReportAnalyzer
analysis-services azure-analysis-services externaltools powerbi
Last synced: 8 months ago
JSON representation
A tool for visualizing and analyzing a Power BI report's performance.
- Host: GitHub
- URL: https://github.com/m-kovalsky/ReportAnalyzer
- Owner: m-kovalsky
- License: mit
- Created: 2021-10-08T08:48:55.000Z (over 4 years ago)
- Default Branch: main
- Last Pushed: 2022-11-14T10:13:40.000Z (over 3 years ago)
- Last Synced: 2025-04-03T12:52:13.274Z (12 months ago)
- Topics: analysis-services, azure-analysis-services, externaltools, powerbi
- Homepage:
- Size: 49.8 KB
- Stars: 94
- Watchers: 11
- Forks: 14
- Open Issues: 11
-
Metadata Files:
- Readme: README.md
- License: LICENSE
Awesome Lists containing this project
- jimsghstars - m-kovalsky/ReportAnalyzer - A tool for visualizing and analyzing a Power BI report's performance. (Others)
README
# [Report Analyzer](https://github.com/m-kovalsky/ReportAnalyzer/releases/latest)
## Report Analyzer Introduction with Reid Havens
[](https://www.youtube.com/watch?v=WT_5nOPdbqk&t=2s&ab_channel=HavensConsulting)

## Purpose
This tool is designed to help Power BI developers/admins match Visual IDs from [Log Analytics](https://docs.microsoft.com/power-bi/transform-model/log-analytics/desktop-log-analytics-overview) to specific visuals in their Power BI report. Additionally, Report Analyzer provides a visual interface for prioritizing performance troubleshooting.
## Running the tool
Report Analyzer is an [External Tool](https://docs.microsoft.com/power-bi/transform-model/desktop-external-tools) for [Power BI Desktop](https://powerbi.microsoft.com/desktop).
In order to take full advantage of the tool, make sure you run the [Performance Analyzer](https://docs.microsoft.com/power-bi/create-reports/desktop-performance-analyzer) across all tabs in your Power BI report and [export](https://docs.microsoft.com/en-us/power-bi/create-reports/desktop-performance-analyzer#saving-performance-information) the results to a .json file. Save the performance data file to the same folder as your Power BI Desktop/Template file(s). Report Analyzer is able to handle multiple .pbix/.pbit files as well as multiple Performance Analyzer .json files.
*NOTE: There is no specific naming requirement for performance data .json files.*
1. [Install Report Analyzer](https://github.com/m-kovalsky/ReportAnalyzer/releases/latest).
2. Open Power BI Desktop.
3. Navigate to 'External Tools' in the ribbon.
4. Open Report Analyzer.
5. Select the folder which contains your [Power BI Desktop](https://powerbi.microsoft.com/desktop/) (or Power BI Template) file(s) as well as the Performance Analyzer export (.json) file.
*NOTE: As of v1.3.0, you can also open Report Analyzer from the Start menu or the Desktop shortcut. It is not necessary to open Report Analyzer through Power BI Desktop.*
## Compatiblity
This tool is compatible with [Power BI Desktop](https://powerbi.microsoft.com/desktop), Power BI Templates, and [Performance Analyzer](https://docs.microsoft.com/power-bi/create-reports/desktop-performance-analyzer) data (.json) files. All files must be in the same folder for the tool to integrate all of these files.
## Features
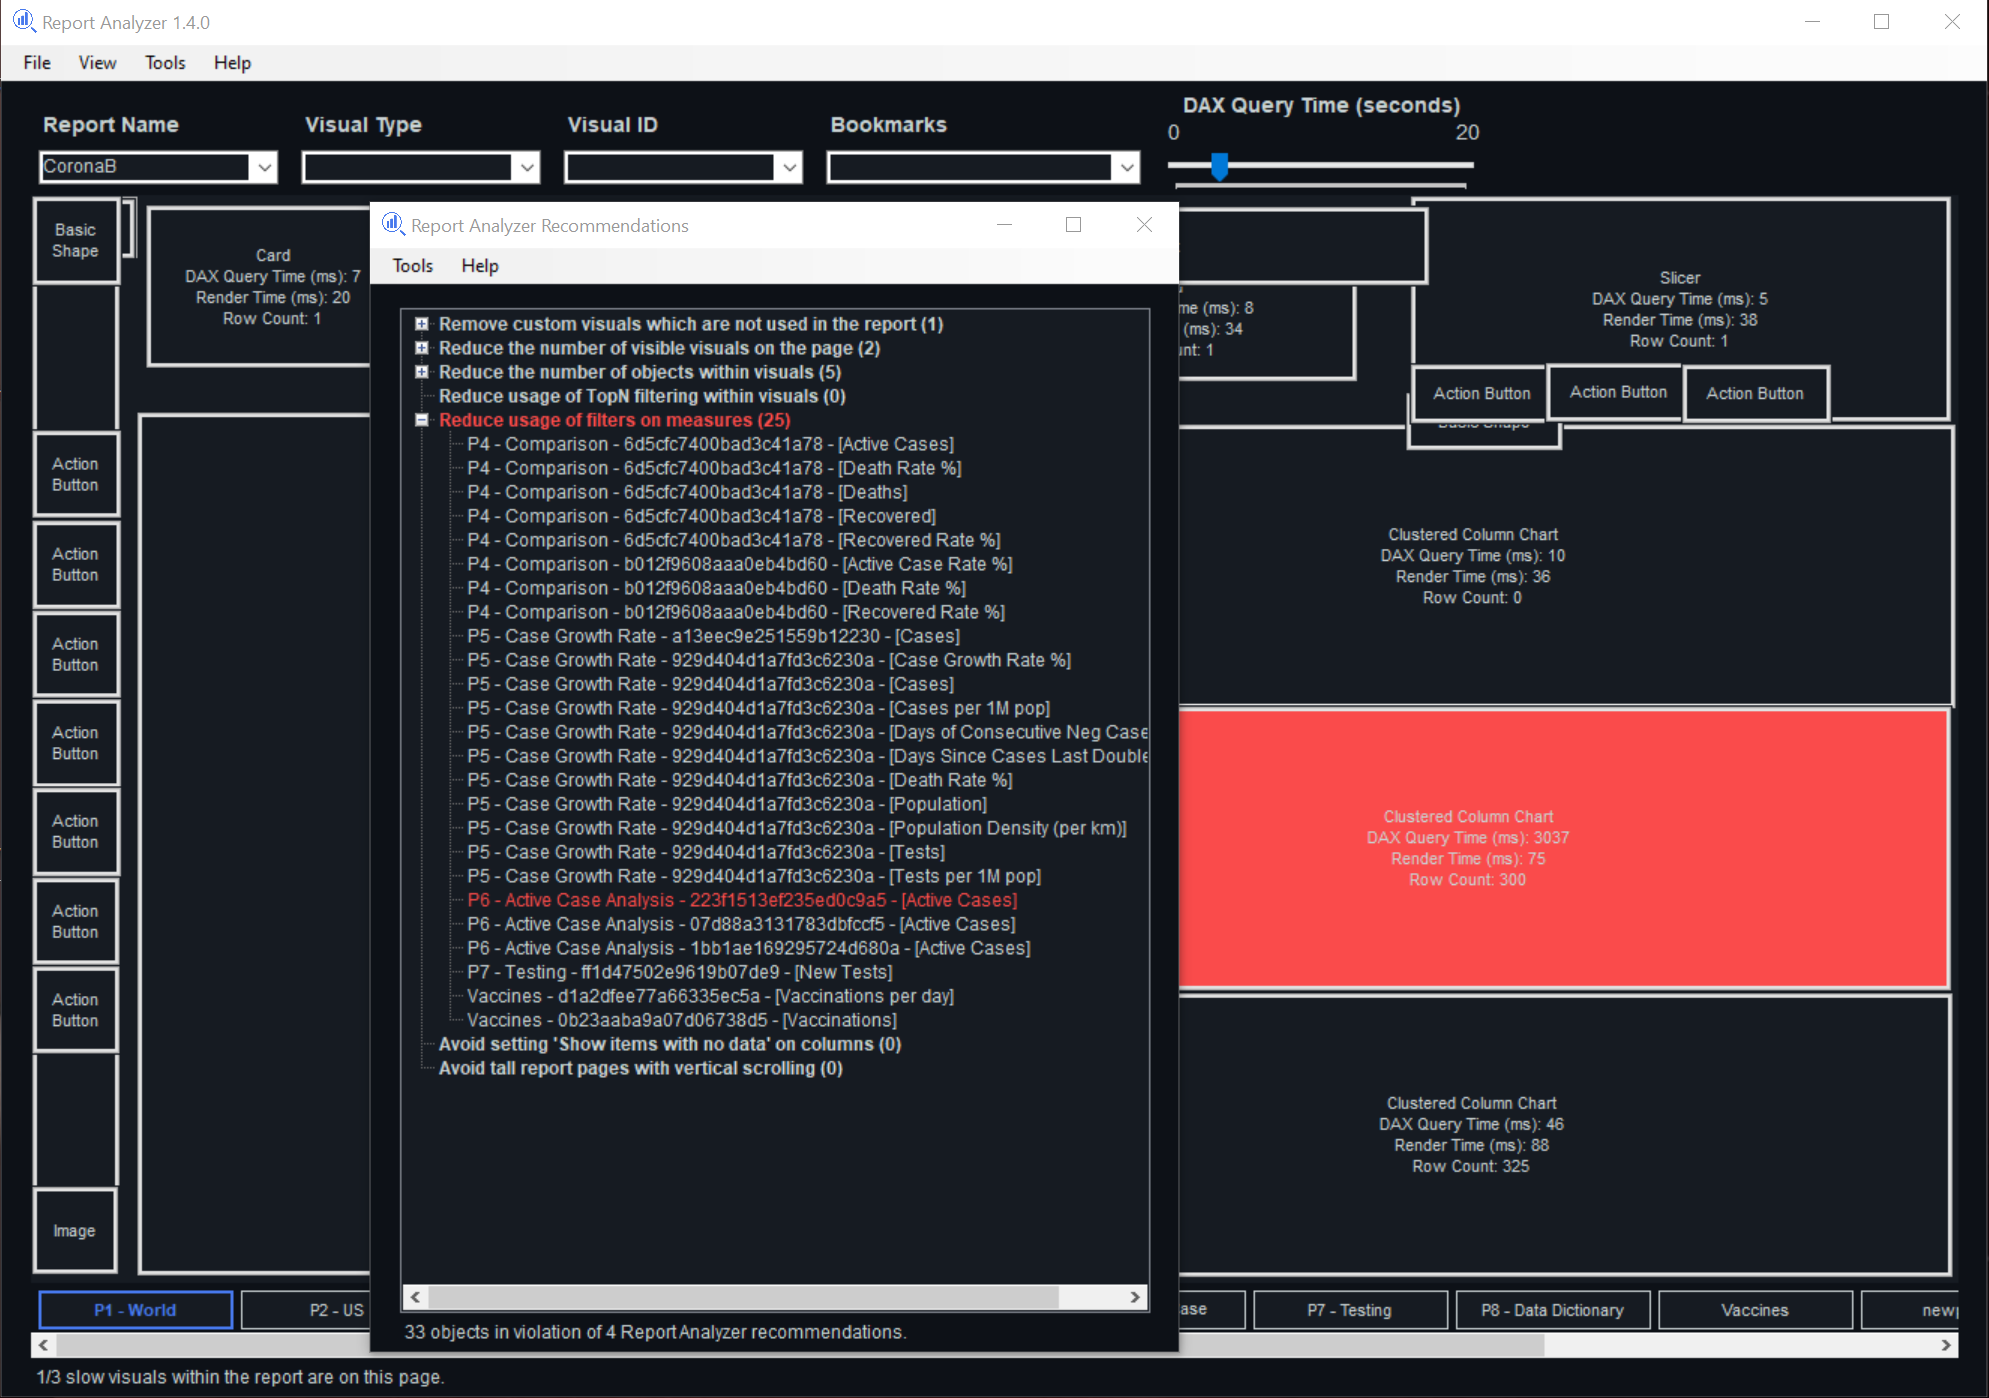
* Visually see [Performance Analyzer](https://docs.microsoft.com/power-bi/create-reports/desktop-performance-analyzer) data overlaid on each visual on a simulated Power BI Desktop canvas.
* Find a specific visual by searching by Visual ID (especially useful for matching Visual IDs from [Log Analytics](https://docs.microsoft.com/power-bi/transform-model/log-analytics/desktop-log-analytics-overview)).
* Use the Visual Type slicer to easily see all visuals of a specific visual type (i.e. Card).
* Setting the DAX Query Time slider highlights visuals (with a red fill) with DAX Query times slower than the selected time (in seconds).
* Hover over a visual to see additional visual metadata.
* Visual ID, Visual Name, Page Name, Report Name, DAX Query Time, Render Time, Row Count, Columns Used, Measures Used, Hierarchies Used, Custom Visual Flag, Visual Contains a [Report-Level Measure](https://www.elegantbi.com/post/reportlevelmeasures).
* Click on a visual to copy additional metadata pertaiing to that visual to the clipboard (including the DAX Query).
* Supports loading multiple Power BI Desktop/Template files and automatically associating them with the Performance Analyzer .json files (must all be in the folder selected in the start screen).
* Dark mode out of the box.
* [Report Analyzer Recommendations](https://www.elegantbi.com/post/reportanalyzerrecos) (as of v1.1.0).
* Export Report Metadata (as of v1.2.0) - this exports the report metadata (objects) in the same fashion as the [Export Report Objects](https://github.com/m-kovalsky/Tabular#export-report-objects) script.
* The Bookmarks slicer allows for updating the simulated Power BI canvas to show the visuals per the settings of the selected bookmark (as of v1.4.0).
## [Recommendations](https://www.elegantbi.com/post/reportanalyzerrecos)
* Make sure to see my [blog post](https://www.elegantbi.com/post/reportanalyzerrecos) on this topic for additional context regarding the recommendations!
* These recommendations are meant to complement the [Best Practice Rules](https://github.com/microsoft/Analysis-Services/tree/master/BestPracticeRules) for [Tabular Editor](https://tabulareditor.com/)'s [Best Practice Analyzer](https://docs.tabulareditor.com/te2/Best-Practice-Analyzer.html) as those rules focus on the model side whereas these recommendations focus on the report side.
* 7 pre-loaded recommendations available to be run against your reports.
* Following these recommendations will generally yield more performant reports.
* Each recommendation and object has tooltips on hover which provide additional context regarding the recommendation and objects which violate the best practice.
* Clicking on objects within the recommendations will navigate you to the particular page/visual where additional information can be found and performance improvement actions can commence.
* Recommendations in red text have visuals which are deemed 'slow queries' (based on the DAX Query Time slider).
* Visuals in red text are deemed 'slow queries' (based on the DAX Query Time slider).
* Prioritization for visual performance troubleshooting should commence with rules/visuals in red text as those indicate visuals which are designated as slow.
* The number in parenthesis next to a recommendation shows the number of objects which violate the recommendation.
* The number in parenthesis next to a violation shows the number of objects within that object (visual/page/report).
## Log Analytics Visual Matching
Report Analyzer can be used to match Log Analytics queries to a specific visual in a Power BI report. In order to do this, follow these steps:
1. Navigate to your [Log Analytics](https://docs.microsoft.com/power-bi/transform-model/log-analytics/desktop-log-analytics-overview) Workspace.
2. Click on 'Logs' within the 'General' category on the left pane.
3. Paste the [Kusto](https://docs.microsoft.com/azure/data-explorer/kusto/query/) query (see below).
4. Add any additional filters to the Kusto query (as desired - perhaps based on time etc.).
5. Find the Visual ID within Log Analytics in the Visual ID slicer within Report Analyzer (must be connected to the same report).
*NOTE: The following Kusto query displays the slowest Power BI queries at the top so you can easily prioritize the queries which need the most attention.*
```kusto
PowerBIDatasetsWorkspace
| where OperationName == "QueryEnd"
| project PowerBIWorkspaceName
,DatasetId = tostring(parse_json(ApplicationContext).DatasetId)
,ReportId = tostring(parse_json(parse_json(ApplicationContext).Sources[0]).ReportId)
,VisualId = tostring(parse_json(parse_json(ApplicationContext).Sources[0]).VisualId)
,DurationMs
,EventText
,ApplicationContext
| order by DurationMs desc
```
*NOTE: A simple way to find the Report ID of a Power BI report is by navigating to the report page within [PowerBI.com]("https://www.powerbi.com") and copying the GUID within the URL after 'reports' (highlighted in orange in the screenshot below).*

## Disclaimer
* In order to obtain the report metadata, Report Analyzer 'hacks' into the Power BI Desktop file. This type of operation is not supported by Microsoft.