https://github.com/macbre/data-flow-graph
Uses your app logs to visualize how the data moves between the code, database, HTTP services, message queue, external storages etc.
https://github.com/macbre/data-flow-graph
d3-visualization d3js data-flow database elasticsearch graph graphviz graphviz-dot kibana mysql performance-visualization query sankey-diagram sql sql-logs sus sustainability visualization
Last synced: 8 months ago
JSON representation
Uses your app logs to visualize how the data moves between the code, database, HTTP services, message queue, external storages etc.
- Host: GitHub
- URL: https://github.com/macbre/data-flow-graph
- Owner: macbre
- License: mit
- Created: 2017-05-26T16:12:38.000Z (about 9 years ago)
- Default Branch: master
- Last Pushed: 2024-04-15T23:26:28.000Z (about 2 years ago)
- Last Synced: 2025-02-01T08:41:51.273Z (over 1 year ago)
- Topics: d3-visualization, d3js, data-flow, database, elasticsearch, graph, graphviz, graphviz-dot, kibana, mysql, performance-visualization, query, sankey-diagram, sql, sql-logs, sus, sustainability, visualization
- Language: Python
- Homepage: https://macbre.github.io/data-flow-graph/
- Size: 317 KB
- Stars: 23
- Watchers: 2
- Forks: 2
- Open Issues: 6
-
Metadata Files:
- Readme: README.md
- License: LICENSE
Awesome Lists containing this project
- awesome-starred - macbre/data-flow-graph - Uses your app logs to visualize how the data moves between the code, database, HTTP services, message queue, external storages etc. (database)
README
# data-flow-graph
[](https://pypi.python.org/pypi/data_flow_graph)
[](https://travis-ci.org/macbre/data-flow-graph)
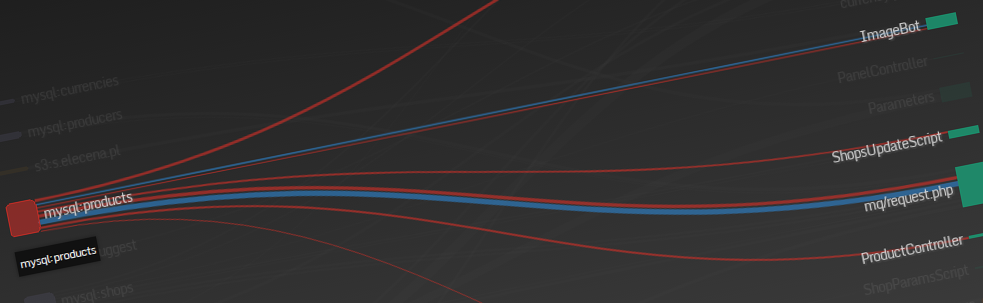
Takes application logs from Elasticsearch (because you do have logs, right?) and **visualizes how your data flow through the database** allowing you to quickly identify **which parts of your code inserts / updates / deletes / reads data from specific DB tables**.
This can be extended to handle:
* message queues (Redis, RabbitMQ, [`Scribe`](https://github.com/facebookarchive/scribe), ...)
* HTTP services communication (GET, POST requests)
* Amazon's S3 storage operations
* tcpdump / varnishlog traffic between the hosts
* (*use your imagintation*)
`data-flow-graph` uses [d3.js](https://d3js.org/) library to visualize the data flow (heavily inspired by [this demo](http://bl.ocks.org/Neilos/584b9a5d44d5fe00f779) by Neil Atkinson).
Alternatively, you can generate `*.gv` file and render it using [Graphviz](https://www.graphviz.org/).
# [Live demo](https://macbre.github.io/data-flow-graph/)
## Graphs sharing
### Via Gist
For easy dataflow sharing you can **[upload](https://gist.github.com/macbre/ddf5742b8293062cc78b767fccb5197b) graph data in TSV form to Gist** and [**have it visualized**](https://macbre.github.io/data-flow-graph/gist.html#ddf5742b8293062cc78b767fccb5197b). [Specific gist revisions](https://macbre.github.io/data-flow-graph/gist.html#ef35fb2e6ea7cc617d59090ab1e89618@e3cadc15b51967093a5eae1dff8229cffb0df120) are also supported.
### Via s3
You can also **upload TSV file to your s3 bucket** (and have [CORS set up there](https://github.com/macbre/data-flow-graph/issues/20)). Navigate to [tsv.html](https://macbre.github.io/data-flow-graph/tsv.html) or [check the example](https://macbre.github.io/data-flow-graph/tsv.html#https://s3.amazonaws.com/s3.macbre.net/data_flow/database.tsv) from [elecena.pl](https://github.com/elecena/data-flow/tree/master/output).
## `dataflow.tsv`
Visualization is generated for a TSV file with the following format:
```
(source node)\t(edge label)\t(target node)\t(edge weight - optional)\t(optional metadata displayed in edge on-hover tooltip)
```
## Example
```tsv
# a comment - will be ignored by the visualization layer
mq/request.php _update mysql:shops 0.0148 QPS: 0.1023
sphinx:datasheets search Elecena\Services\Sphinx 0.1888 QPS: 1.3053
mysql:products getImagesToFetch ImageBot 0.0007 QPS: 0.0050
sphinx:products search Elecena\Services\Sphinx 0.0042 QPS: 0.0291
sphinx:products getIndexCount Elecena\Services\Sphinx 0.0001 QPS: 0.0007
sphinx:products products Elecena\Services\Search 0.0323 QPS: 0.2235
currency.php _ mysql:currencies 0.0001 QPS: 0.0008
sphinx:products getLastChanges StatsController 0.0002 QPS: 0.0014
mysql:suggest getSuggestions Elecena\Services\Sphinx 0.0026 QPS: 0.0181
mq/request.php _delete mysql:shops_stats 0.0004 QPS: 0.0030
sphinx:parameters getDatabaseCount Parameters 0.0002 QPS: 0.0010
```
> Node names can by categorized by adding a `label` followed by `:` (e.g. `mysql:foo`, `sphinx:index`, `solr:products`, `redis:queue`)
## Generating TSV file for data flow
You can write your own tool to analyze logs. It just needs to emit TSV file that matches the above format.
[`sources/elasticsearch/logs2dataflow.py`](https://github.com/macbre/data-flow-graph/blob/master/sources/elasticsearch/logs2dataflow.py) is here as an example - it was used to generate TSV for a [demo](https://macbre.github.io/data-flow-graph/) of this tool. 24 hours of logs from [elecena.pl](https://elecena.pl/ ) were analyzed (1mm+ of SQL queries).
## Python module
```
pip install data_flow_graph
```
Please refer to `/test` directory for examples on how to use helper functions to generate Graphviz and TSV-formatted data flows.
### Generating graphviz's dot file
```python
from data_flow_graph import format_graphviz_lines
lines = [{
'source': 'Foo "bar" test',
'metadata': '"The Edge"',
'target': 'Test "foo" 42',
}]
graph = format_graphviz_lines(lines)
```
### Generating TSV file
```python
from data_flow_graph import format_tsv_lines
lines = [
{
'source': 'foo',
'edge': 'select',
'target': 'bar',
},
{
'source': 'foo2',
'edge': 'select',
'target': 'bar',
'value': 0.5,
'metadata': 'test'
},
]
tsv = format_tsv_lines(lines)
```
## Links
* [vis.js](https://github.com/almende/vis) for visualization ([a graph example](http://etn.io/))
* [Interactive & Dynamic Force-Directed Graphs with D3](https://medium.com/ninjaconcept/interactive-dynamic-force-directed-graphs-with-d3-da720c6d7811)
* [d3.js curved links graph](https://bl.ocks.org/mbostock/4600693)
* [Bi-directional hierarchical sankey diagram](http://bl.ocks.org/Neilos/584b9a5d44d5fe00f779)