https://github.com/magespecialist/mage-chrome-toolbar
Magento Chrome Toolbar for MSP_DevTools
https://github.com/magespecialist/mage-chrome-toolbar
Last synced: 8 months ago
JSON representation
Magento Chrome Toolbar for MSP_DevTools
- Host: GitHub
- URL: https://github.com/magespecialist/mage-chrome-toolbar
- Owner: magespecialist
- Created: 2016-08-10T07:56:09.000Z (over 9 years ago)
- Default Branch: master
- Last Pushed: 2024-04-22T16:30:32.000Z (over 1 year ago)
- Last Synced: 2024-11-01T22:38:02.247Z (about 1 year ago)
- Language: JavaScript
- Size: 9.15 MB
- Stars: 331
- Watchers: 31
- Forks: 41
- Open Issues: 13
-
Metadata Files:
- Readme: README.md
Awesome Lists containing this project
- awesome-magento2 - Mage Chrome Toolbar - A MUST-HAVE Chrome Extension for (Tools / Meet Magento)
README
# Magento Chrome Toolbar for MSP DevTools
**Magento Chrome Toolbar** is a chrome extension to be used with **MSP_DevTools** for **Magento 1** or **Magento 2**.
This extension allows you to **quickly access** the information you need to debug your Magento performances,
to build your new theme or to modify an existing one.
## How can I install it?
Just install from **[Chrome WebStore][1]**.
Now you have the Chrome extension, next step is to install and configure the **Magento extension**.
### Installing on Magento 1:
* Download and unzip in the Magento root: https://github.com/magespecialist/m1-MSP_DevTools/archive/master.zip.
* Flush your cache.
* Open Magento backend and go to `System > Configuration > MageSpecialist > DevTools`.
* Enable devtools and set IP restrictions.
* Optionally download PhpStorm **Remote Call Plugin** if you wish to integrate PhpStorm.
This package is also available on **packagist** for Magento 1 composer installation: `composer require msp/devtools-m1`
> Source code available on GitHub: https://github.com/magespecialist/m1-MSP_DevTools
### Installing on Magento 2:
* From your CLI run: `composer require msp/devtools`
* Flush your cache.
* Turn OFF **Full Page Cache** while you are using DevTools.
* Upgrade database data & schema: `php bin/magento setup:upgrade`
* Open Magento backend and go to `Stores > Settings > Configuration > MageSpecialist > DevTools`.
* Enable devtools and set IP restrictions.
* Optionally download PhpStorm **Remote Call Plugin** if you wish to integrate PhpStorm.
> Source code available on GitHub: https://github.com/magespecialist/m2-MSP_DevTools
#### Enabling profiler feature on Magento 2:
If you wish to enable the profiler feature, execute:
```
bin/magento dev:profiler:enable 'MSP\DevTools\Profiler\Driver\Standard\Output\DevTools'
```
#### Enabling SQL query feature on Magento 2:
Edit `app/etc/env.php` file adding the following key: `$config[db][connection][default][profiler] = 1`
Example:
```
...
),
'db' =>
array (
'table_prefix' => '',
'connection' =>
array (
'default' =>
array (
'host' => 'localhost',
...
'profiler' => '1',
),
),
),
'resource' =>
array (
...
```
## How does it work?
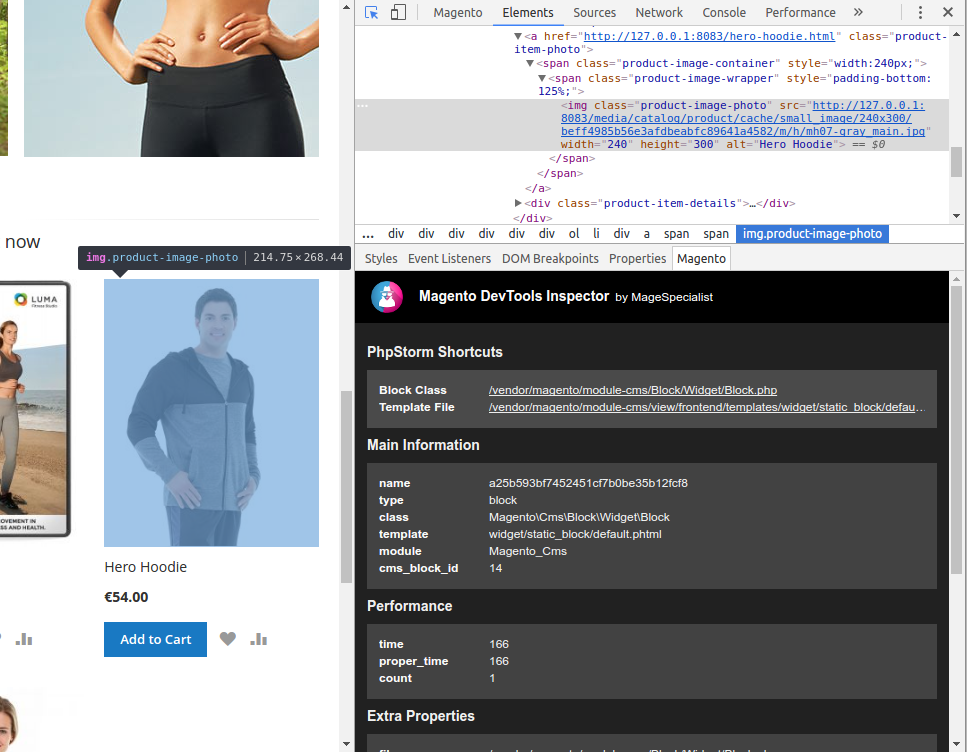
You can access both **Global Page Information** and **Item Information** through **Chrome Inspector**.
#### Inspector integration
### Global Page Information
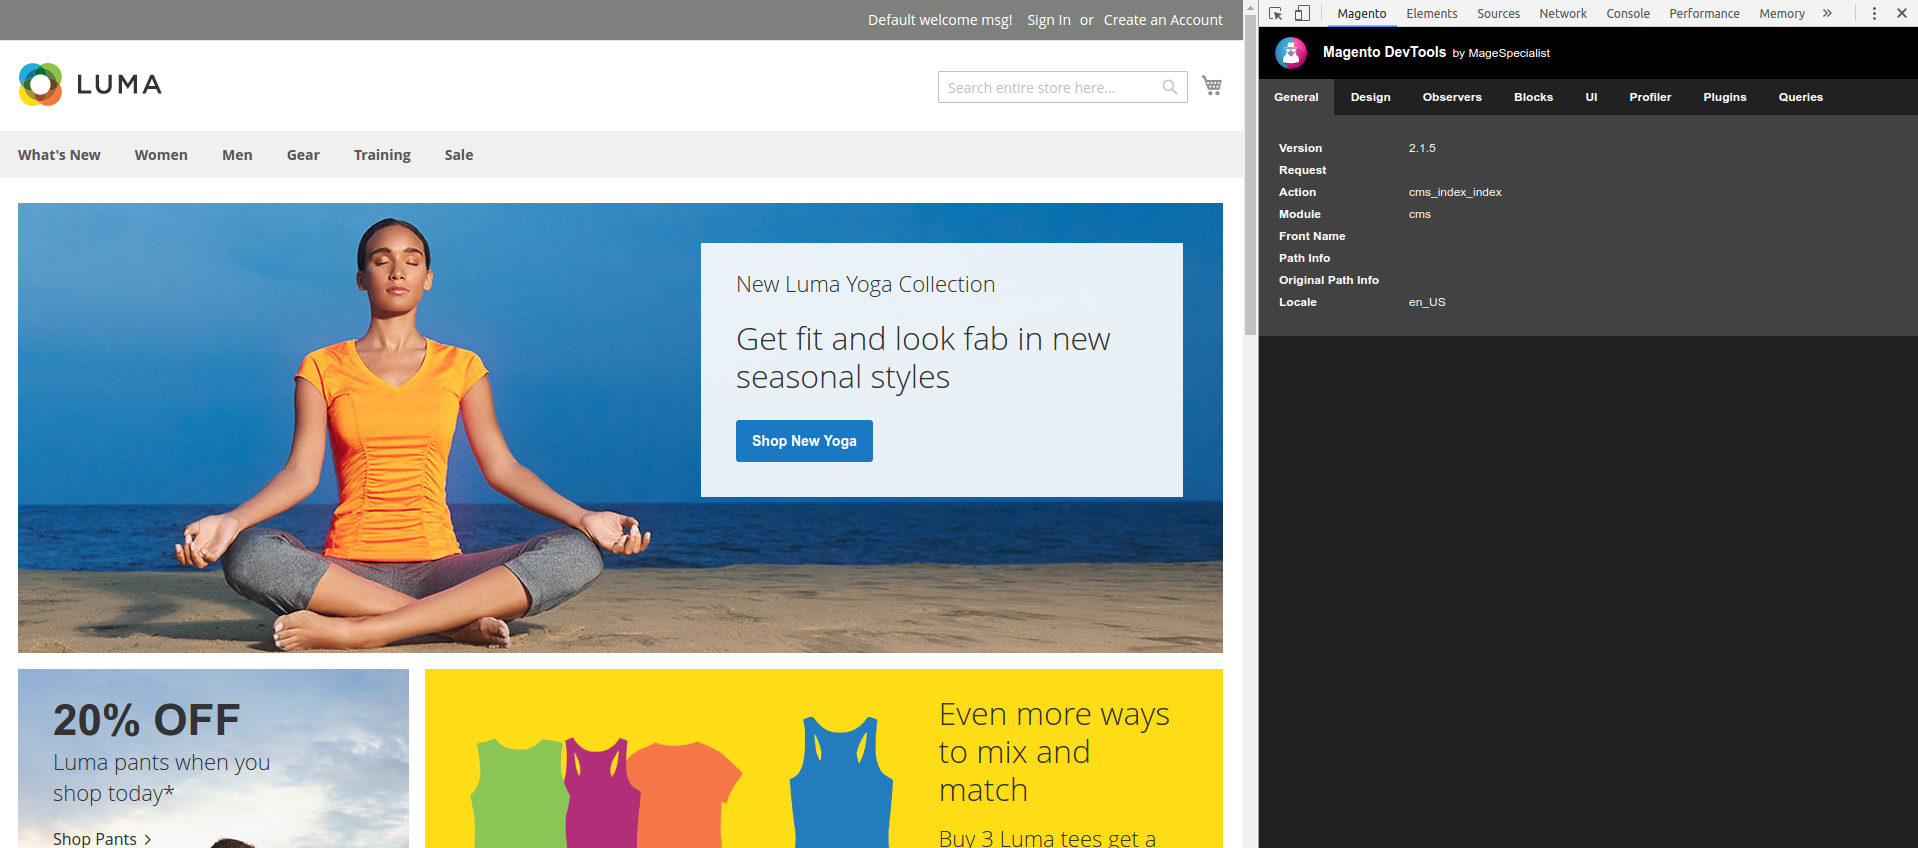
From the main panel you can see information from:
* Theme
* Controller / Router
* Request parameters
* Layout and Layout updates
* Observers
* Data Models inspector
* Collections inspector
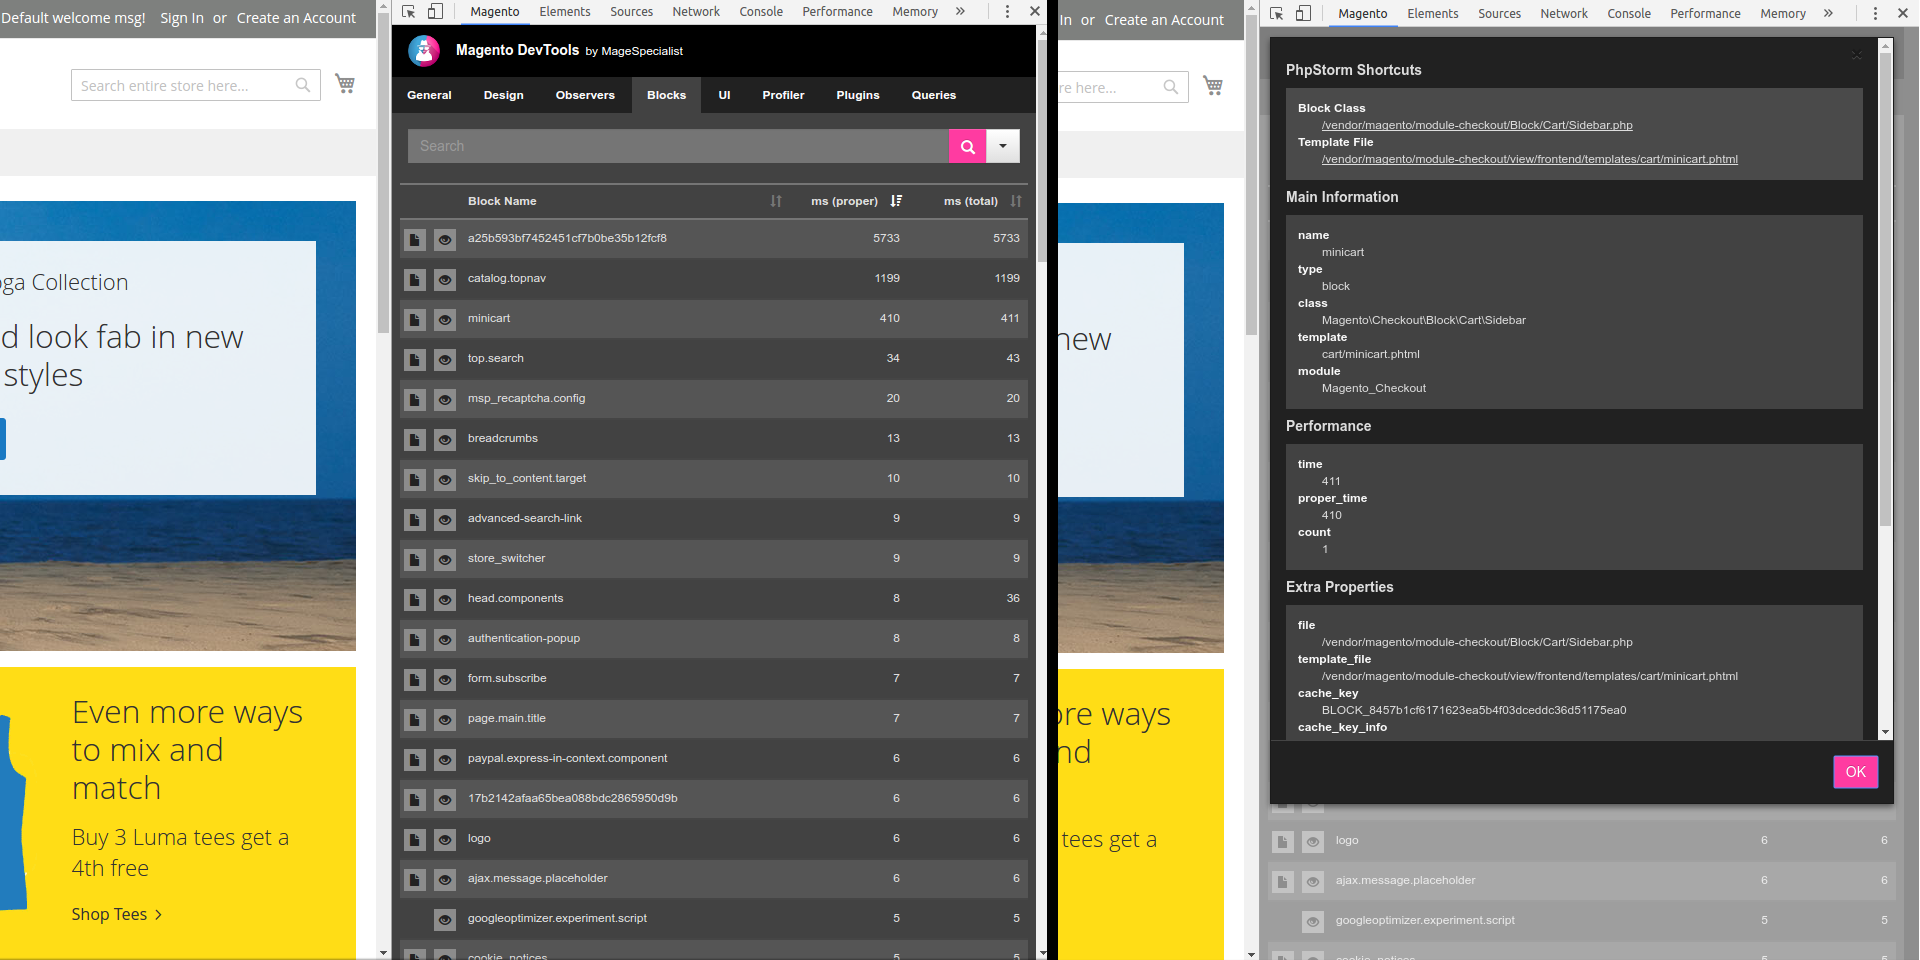
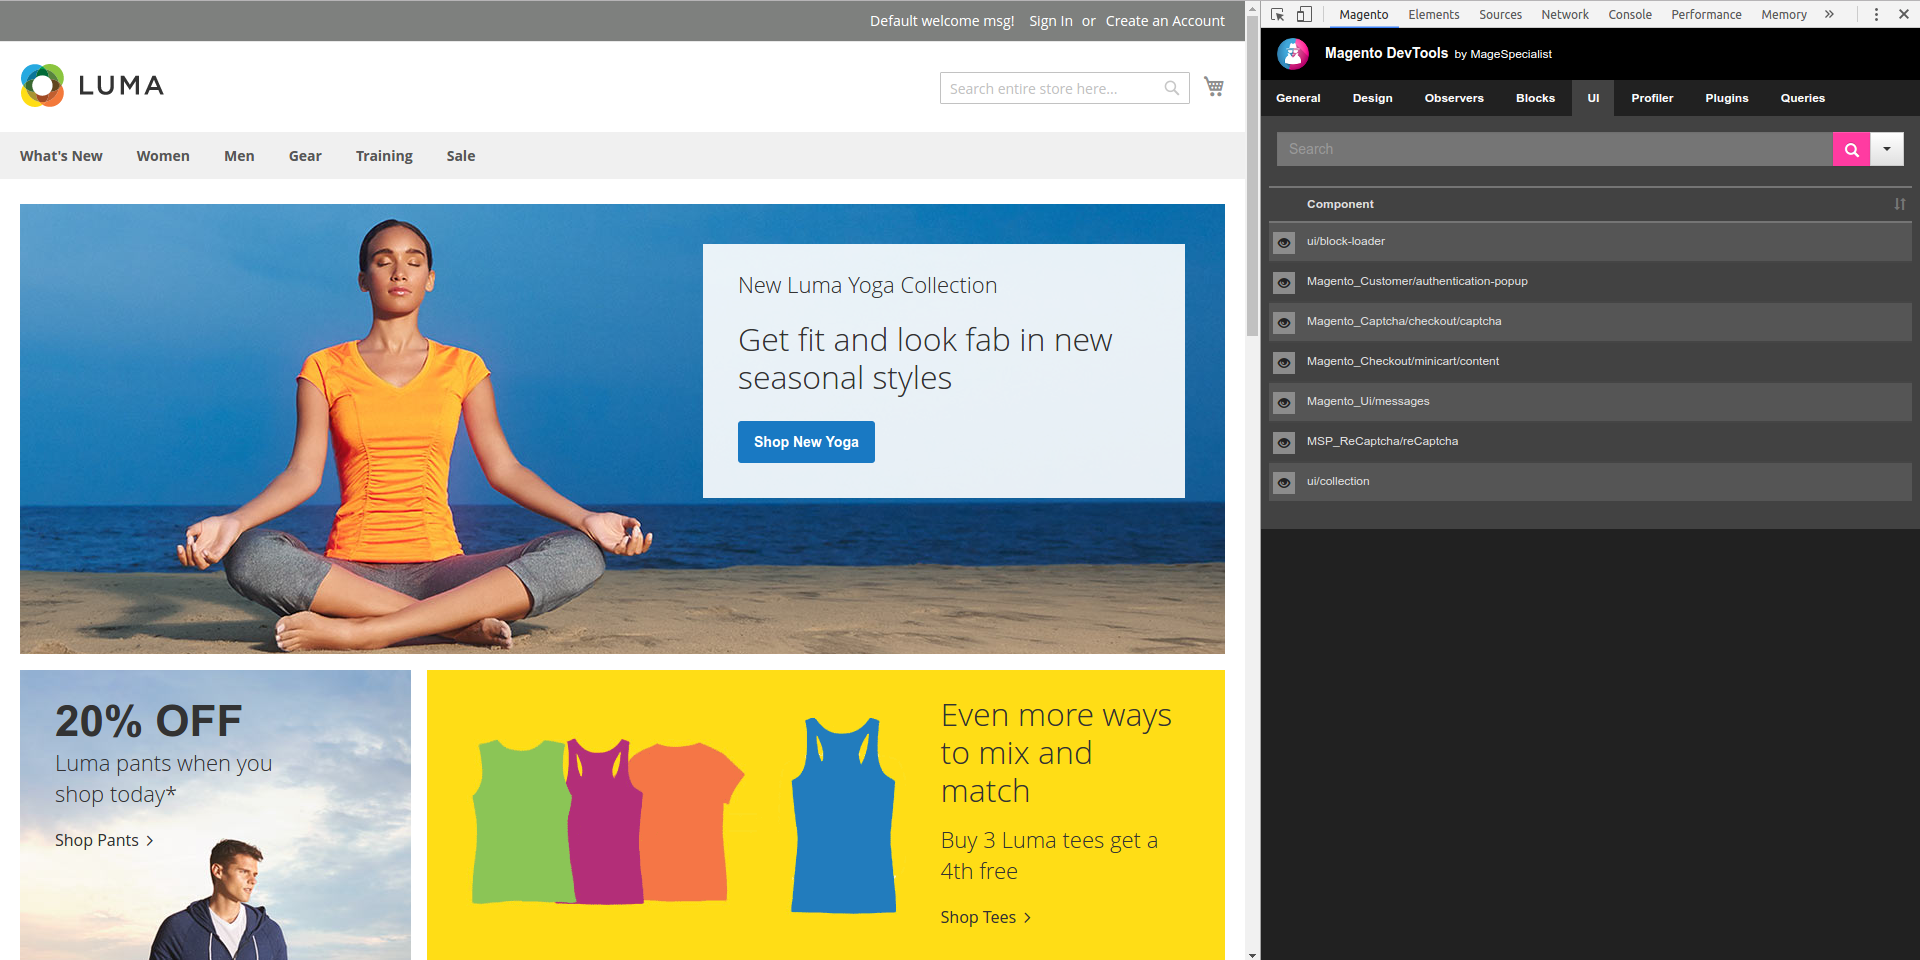
* Blocks, Containers, uiComponents
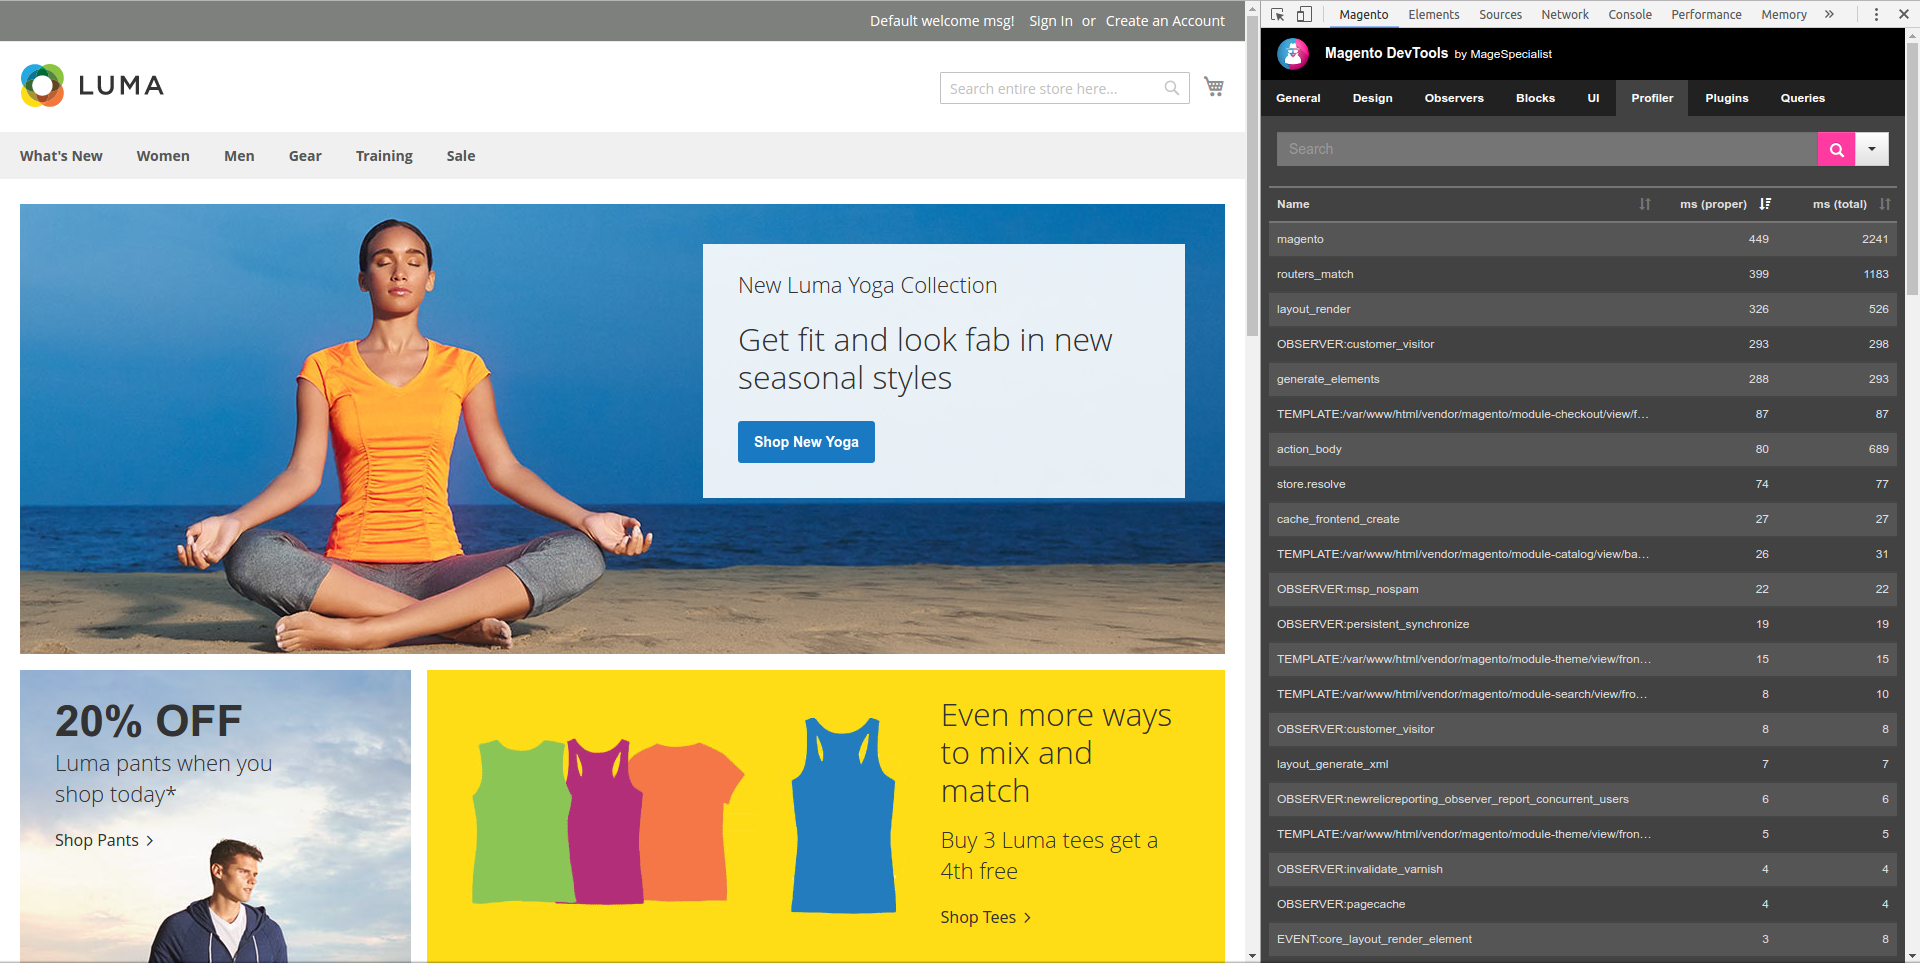
* Profiler
#### Theme, Controller and Global information:
#### Blocks / Containers information:
#### uiComponents information:
#### Profiler information:
#### Data Models information:
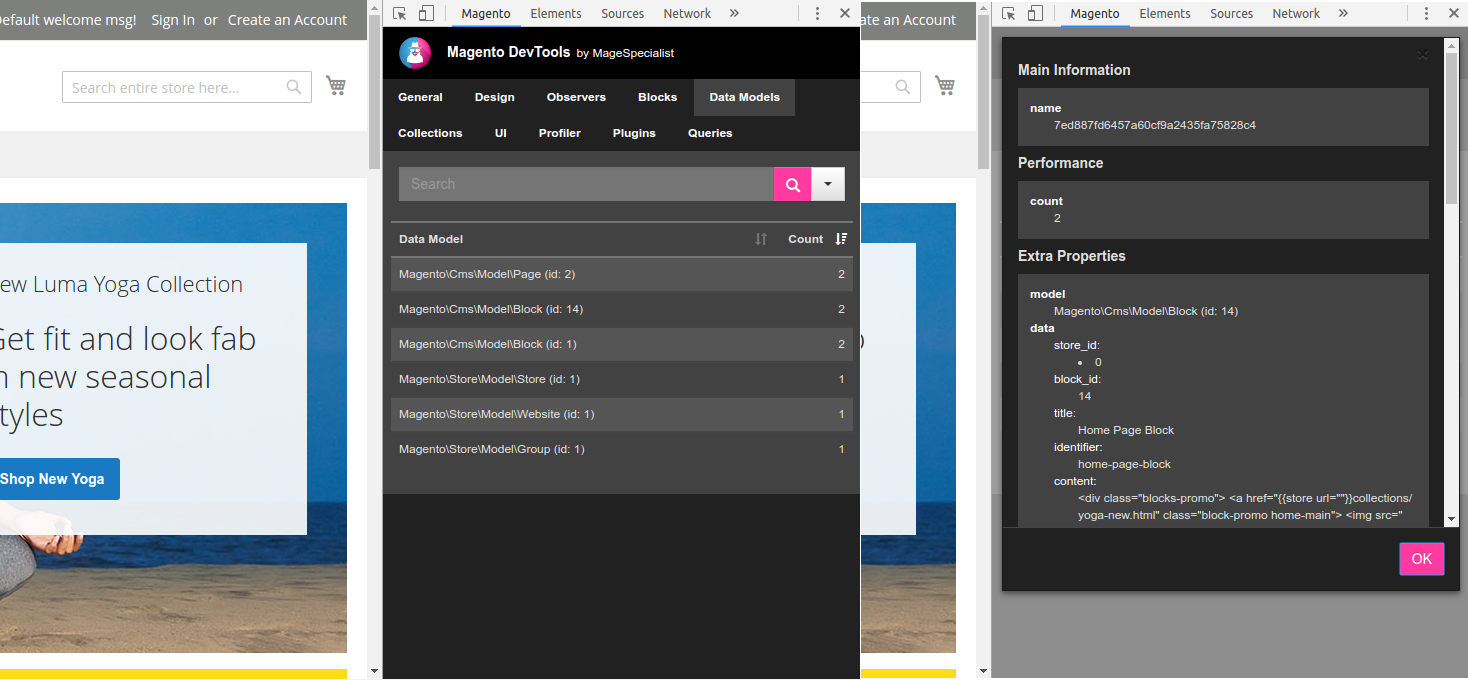
#### Collections information:

### Item Information
Magento Chrome Toolbar is integrated with Chrome Inspector.
By selecting an item in you page you can see:
* Block information
* Used template
* Server elapsed time
* Block nesting
* Template file
* Cache information
* uiComponent information
* Container information
### PhpStorm Integration
Magento Chrome Toolbar can be integrated with **PhpStorm** to directly open the template file you wish to edit.
> You need to install **Remote Call Plugin** in PhpStorm, then enable the feature from Magento Admin.
[1]: https://chrome.google.com/webstore/detail/magespecialist-devtools-f/odbnbnenehdodpnebgldhhmicbnlmapj?authuser=3