https://github.com/mapoart/adobug
Adobe Creative Cloud Apps Debugger/Logger (After Effects, Photoshop, Indesign, Bridge .. Debugging)
https://github.com/mapoart/adobug
Last synced: 3 months ago
JSON representation
Adobe Creative Cloud Apps Debugger/Logger (After Effects, Photoshop, Indesign, Bridge .. Debugging)
- Host: GitHub
- URL: https://github.com/mapoart/adobug
- Owner: mapoart
- License: mit
- Created: 2019-03-24T14:34:26.000Z (over 7 years ago)
- Default Branch: master
- Last Pushed: 2019-03-24T14:41:04.000Z (over 7 years ago)
- Last Synced: 2025-01-20T13:35:06.162Z (over 1 year ago)
- Language: JavaScript
- Size: 175 KB
- Stars: 1
- Watchers: 1
- Forks: 0
- Open Issues: 0
-
Metadata Files:
- Readme: README.md
- License: LICENSE
Awesome Lists containing this project
README
# Adobug 1.11 - After Effects, Photoshop, InDesign, Bridge - Debugger/Logger
It works on After Effects, Bridge CC, InDesign, Photoshop. Rest of the Adobe Creative Cloud Apps don't have `Socket` Implemented.
notice: changed from aedbug as it is not only for After Effects anymore.
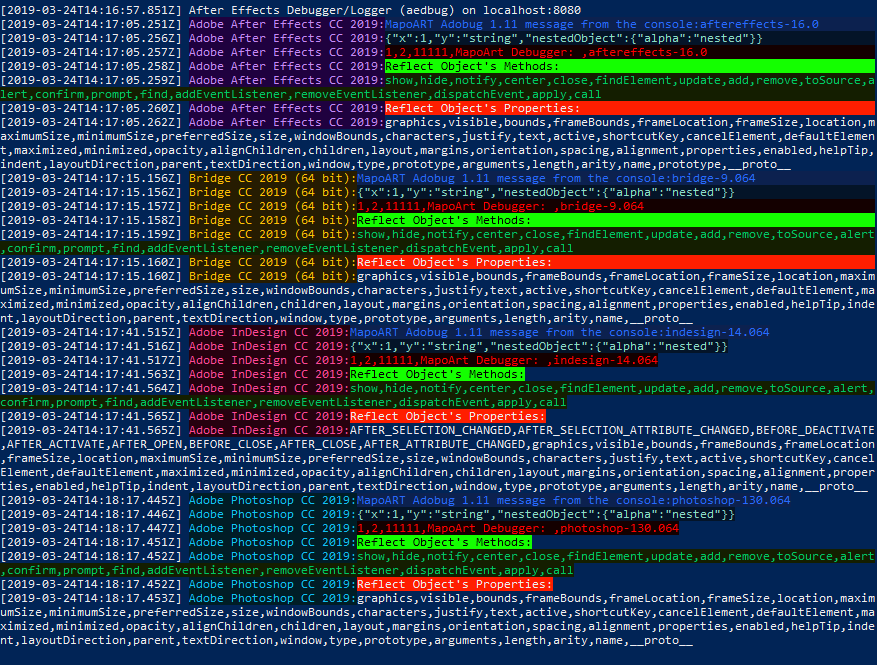
Now you can have one console window which will not dissappear when there are issue with the apps or ESTK. Also you can work on mulitple scripts simultaneously and script will automatically display the program name in the console. Please see below for the example.
Adobug v1.11 has new enabled colors. Tutorial will be soon available.
[](https://marcinpolak.eu)
##### Youtube Tutorial (click on image below) - old version
[](https://www.youtube.com/watch?v=Vs-RAICxWnI) [](https://marcinpolak.eu)
**adobug** (After Effects Debugger/Logger) is an external debugger/logger to use in Adobe After Effects (And Probably Premiere, InDesign, Photoshop scripts etc).
# First enable option in your program (Mac & Windows)
(After Effects, Media Encoder, Audition, Bridge CC, Adobe Illustrator, InDesign, Photoshop, Premiere Pro, Premiere Rush)
**Preferences->General->Allow Scripts to write files & Access Network**
# Example (test.jsx)
include the **aedbug.jsx** in your script and use it like:
//use debug for strings, arrays or objects
```sh
adobug(rgb("MapoART Adobug 1.11 message from the console:" + BridgeTalk.appSpecifier,39,106,255,12,33,79));
var obj = {x:1, y: "string", nestedObject: {alpha:'nested'}};
adobug(rgb(obj,140,220,200,4,20,40));
var arr = [1,2,11111,"MapoArt Debugger: ", BridgeTalk.appSpecifier];
adobug(rgb(arr,255,1,0,20,0,0));
var reflectMethods = Window.reflect.methods;
adobug(rgb("Reflect Object's Methods:",1,1,1,20,255,0));
adobug(rgb(reflectMethods, 0,200,100,20,30,0));
var reflectProperties = Window.reflect.properties;
adobug(rgb("Reflect Object's Properties:",0,0,0,255,30,0));
adobug(reflectProperties); // default colors
```
# External Log Server Installation
To run server use npm and nodejs (JavaScript) (different languages will be implemented later if needed)
# Startup Script
There is new batch file(start.bat) to start on windows (cmd.exe or PowerShell.exe). Just go to desire folder and run:
```sh
git clone git@github.com:mapos/adobug.git
cd adobug
.\start.bat
```
to start without start.bat script use the commmands:
```sh
npm install
npm start
```
### Todos
- ~~Methods/Props debugging~~ `done`
- ~~Coloring~~ `done`
- Debug/Log write to file
- Other languages server versions PHP, Ruby, Python, Go etc.
License
----
MIT