https://github.com/mapschool/course
An introduction to the art and science of modern cartography
https://github.com/mapschool/course
Last synced: about 1 month ago
JSON representation
An introduction to the art and science of modern cartography
- Host: GitHub
- URL: https://github.com/mapschool/course
- Owner: mapschool
- License: mit
- Created: 2015-12-29T13:44:14.000Z (over 9 years ago)
- Default Branch: gh-pages
- Last Pushed: 2016-12-04T04:24:15.000Z (over 8 years ago)
- Last Synced: 2024-11-04T05:33:50.491Z (6 months ago)
- Size: 11.7 KB
- Stars: 51
- Watchers: 9
- Forks: 11
- Open Issues: 2
-
Metadata Files:
- Readme: README.md
- License: LICENSE
Awesome Lists containing this project
- awesome-starred - mapschool/course - An introduction to the art and science of modern cartography (others)
README
# Digital Cartography 101

> An introduction to the art and science of modern cartography
**Duration:** 5 days
- 5 demo lectures
- 4 explorations
- 2 assignments
**Courseware**
- [Cartography and Visualization - Penn State GEOG 486](https://www.e-education.psu.edu/geog486/home.html)
## Day 1: The Fundamentals

- [Psychogeography](https://en.wikipedia.org/wiki/Psychogeography)
- **Exploration 1** Create a [dérive](http://www.bopsecrets.org/SI/2.derive.htm)
- [Geography](https://en.wikipedia.org/wiki/Geography)
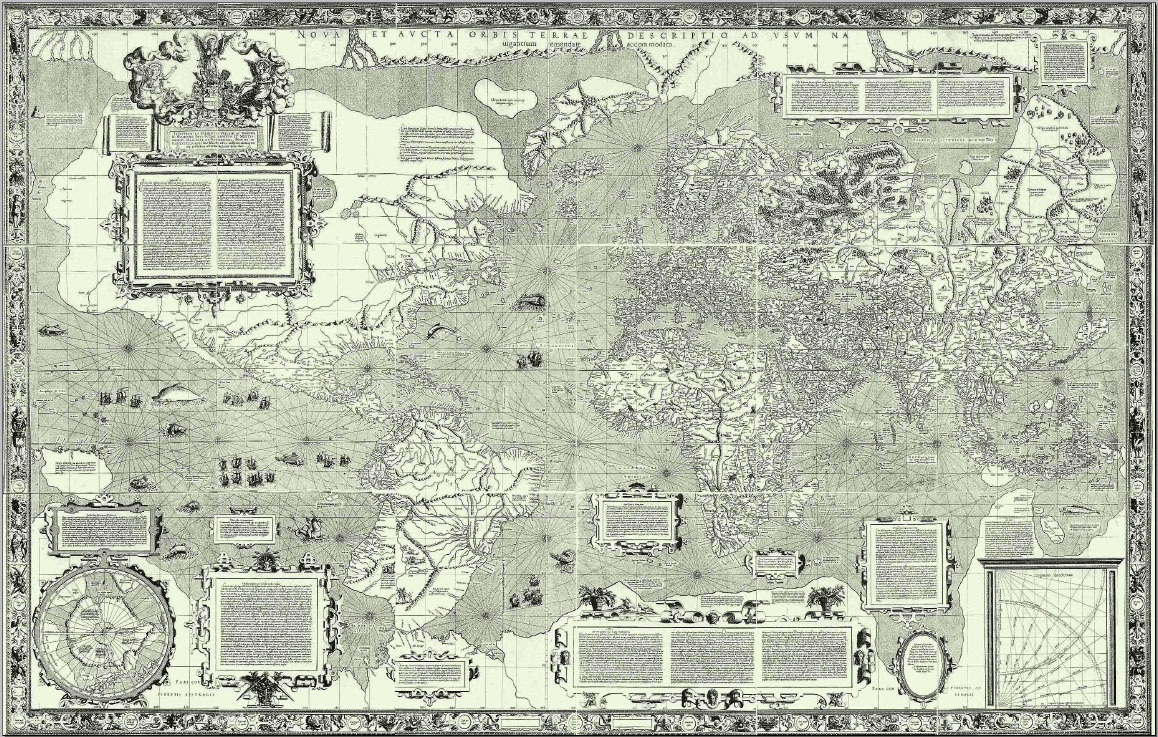
- [History of Cartography](https://en.wikipedia.org/wiki/History_of_cartography)
- [Great Trigonometric Survey of India](https://books.google.co.in/books?id=gd8gAQAAMAAJ&printsec=frontcover#v=onepage&q&f=false) and the [Bangalore connection](http://issuu.com/udayakumarp.l/docs/the_story_of_the_bangalore_baseline)

- Mapping

- [Geoid](https://en.wikipedia.org/wiki/Geoid)
- [Coordinates](https://en.wikipedia.org/wiki/Geographic_coordinate_system): [latitude](https://en.wikipedia.org/wiki/Latitude) and [longitude](https://en.wikipedia.org/wiki/Longitude)
- Positioning: [trigonometry](https://en.wikipedia.org/wiki/Surveying), [remote sensing](https://en.wikipedia.org/wiki/Remote_sensing), [GPS](http://fas.org/man/dod-101/navy/docs/es310/GPS/GPS.htm)
- [Scale](https://en.wikipedia.org/wiki/Scale_(map)): 1:250,000 small scale (world map), 1:10,000 large scale (street map)
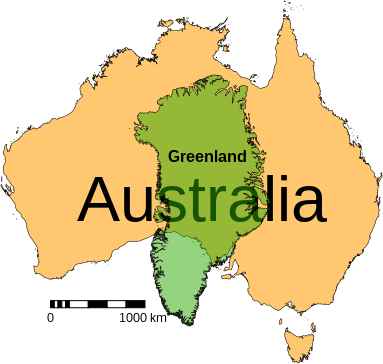
- [Projection](https://en.wikipedia.org/wiki/Map_projection): cylindrical, conic, azimuthal

- **Video** [There is no correct projection](https://www.youtube.com/watch?v=kIID5FDi2JQ)
- Types of maps
- [Pictoral](https://en.wikipedia.org/wiki/Pictorial_maps)
- [Thematic](https://en.wikipedia.org/wiki/Thematic_map)
- [Topographic](https://en.wikipedia.org/wiki/Topographic_map) and [Terrain](https://en.wikipedia.org/wiki/Terrain_cartography)
- [Chloropleth](https://en.wikipedia.org/wiki/Choropleth_map)
- [Cartogram](https://en.wikipedia.org/wiki/Cartogram)
- [Topological](https://en.wikipedia.org/wiki/Topological_map)
- Map symbology
- [Ordanace Survey symbol sheets](https://www.ordnancesurvey.co.uk/resources/maps-and-geographic-resources/map-symbols.html)
- Data abstraction
- **Exploration 2** Create a map of the Bengaluru Airport Bus Network. Focus: utility, data density, clarity
**Reading**
- [Inside the Secret World of Russia’s Cold War Mapmakers](http://www.wired.com/2015/07/secret-cold-war-maps/)
## Day 2: Map design

- Data primitives: [points](), lines, areas
- Cartographic elements
- frame
- metadata
- layering
- pixels
- symbols
- lines
- fills
- text
- Cartographic styling
- Raster
- Color mapping
- Composting
- DEM
- Vector
- Data series
- Exporting maps
- Create a series of maps for your state(A)
- A political map
- A physical map
- A chloropleth map
- **Assignment 1**
**Reading**
- [A Rare Interview With Graphic Design Legend Massimo Vignelli](http://www.fastcodesign.com/3044133/a-rare-interview-with-graphic-design-legend-massimo-vignelli)
## Day 3: Working with Map Data

- [GIS Fundamentals](https://en.wikipedia.org/wiki/Geographic_information_system)
- [Coordinate system](https://en.wikipedia.org/wiki/Geographic_coordinate_system): [WGS 84 Mercator projection](https://en.wikipedia.org/wiki/World_Geodetic_System) and [Web Mercator projection](https://en.wikipedia.org/wiki/Web_Mercator)
- Data Formats: [GeoJSON](), [Shapefile]()
- Existing data sources
- Natural Earth
- Bhuvan
- OSM
- NASA
- Map scans
- Working with OSM
- Creating data
- Extracting data
- Converting
- Formats
- Projection
- Geometry
- Combining
- Joining
- Geoprocessing
- Spatial analysis
- **Exploration 3**
## Day 4: Publishing a web map
- [HTML](https://www.codecademy.com/courses/html-one-o-one/0/1?curriculum_id=4f873b9ac02c44000300000d), [CSS and JS](https://www.codecademy.com/courses/html-javascript-css/0/1)
- Display your map using [Mapbox GL JS](https://www.mapbox.com/mapbox-gl-js/example/custom-style-id/) and test locally using the [Python SimpleHTTPServer](http://www.pythonforbeginners.com/modules-in-python/how-to-use-simplehttpserver/)
- Host your map using [GitHub Pages](https://pages.github.com)
- Style your page using [Mapbox base.css](https://www.mapbox.com/base/)
- Add the [Mapbox geocoder](https://www.mapbox.com/mapbox-gl-js/example/mapbox-gl-geocoder/) and [url hash](https://www.mapbox.com/mapbox-gl-js/api/#Map)
- Explore the [Mapbox GL JS API](https://www.mapbox.com/mapbox-gl-js/api/) using the browser console
- Interactive coding
- [API](https://en.wikipedia.org/w/api.php?action=query&prop=revisions&rvprop=content&rvsection=0&titles=Application%20programming%20interface)
- [Jquery](http://jsfiddle.net/webdevem/Q8KVC/)
- [Callbacks](http://jsfiddle.net/javabeat/y9tGy/)
- [AJAX]()
- [JSON](http://www.jsoneditoronline.org)
- A simple map
- Creating a map view
- Adding map layers
- Adding data layers
- Customizing map controls
- Using Github pages
- **Assignment 2:** Create an interactive tourist map of your favourite place
## Day 5: Data driven maps

- Turf.js
- Tippecanoe
- Mapbox API
- **Exploration 4**
### Software
- [QGIS](http://qgis.org/)
- [Mapbox Studio]()
- [Mapbox.js]()