https://github.com/marcelosmbrrr/devops
Exploring devops with a Laravel application
https://github.com/marcelosmbrrr/devops
gitflow github-actions grafana jenkins laravel prometheus sonarqube
Last synced: 7 months ago
JSON representation
Exploring devops with a Laravel application
- Host: GitHub
- URL: https://github.com/marcelosmbrrr/devops
- Owner: Marcelosmbrrr
- Created: 2024-10-15T04:46:52.000Z (9 months ago)
- Default Branch: main
- Last Pushed: 2024-10-23T00:20:42.000Z (9 months ago)
- Last Synced: 2024-10-28T05:34:07.260Z (8 months ago)
- Topics: gitflow, github-actions, grafana, jenkins, laravel, prometheus, sonarqube
- Language: Visual Basic 6.0
- Homepage:
- Size: 10.8 MB
- Stars: 0
- Watchers: 1
- Forks: 0
- Open Issues: 0
-
Metadata Files:
- Readme: README.md
Awesome Lists containing this project
README
# About
This project is built with Laravel 11 to explore the integration of advanced DevOps tools throughout the development and production lifecycle. The objective is explore the essential of modern DevOps practices.
## Gitflow

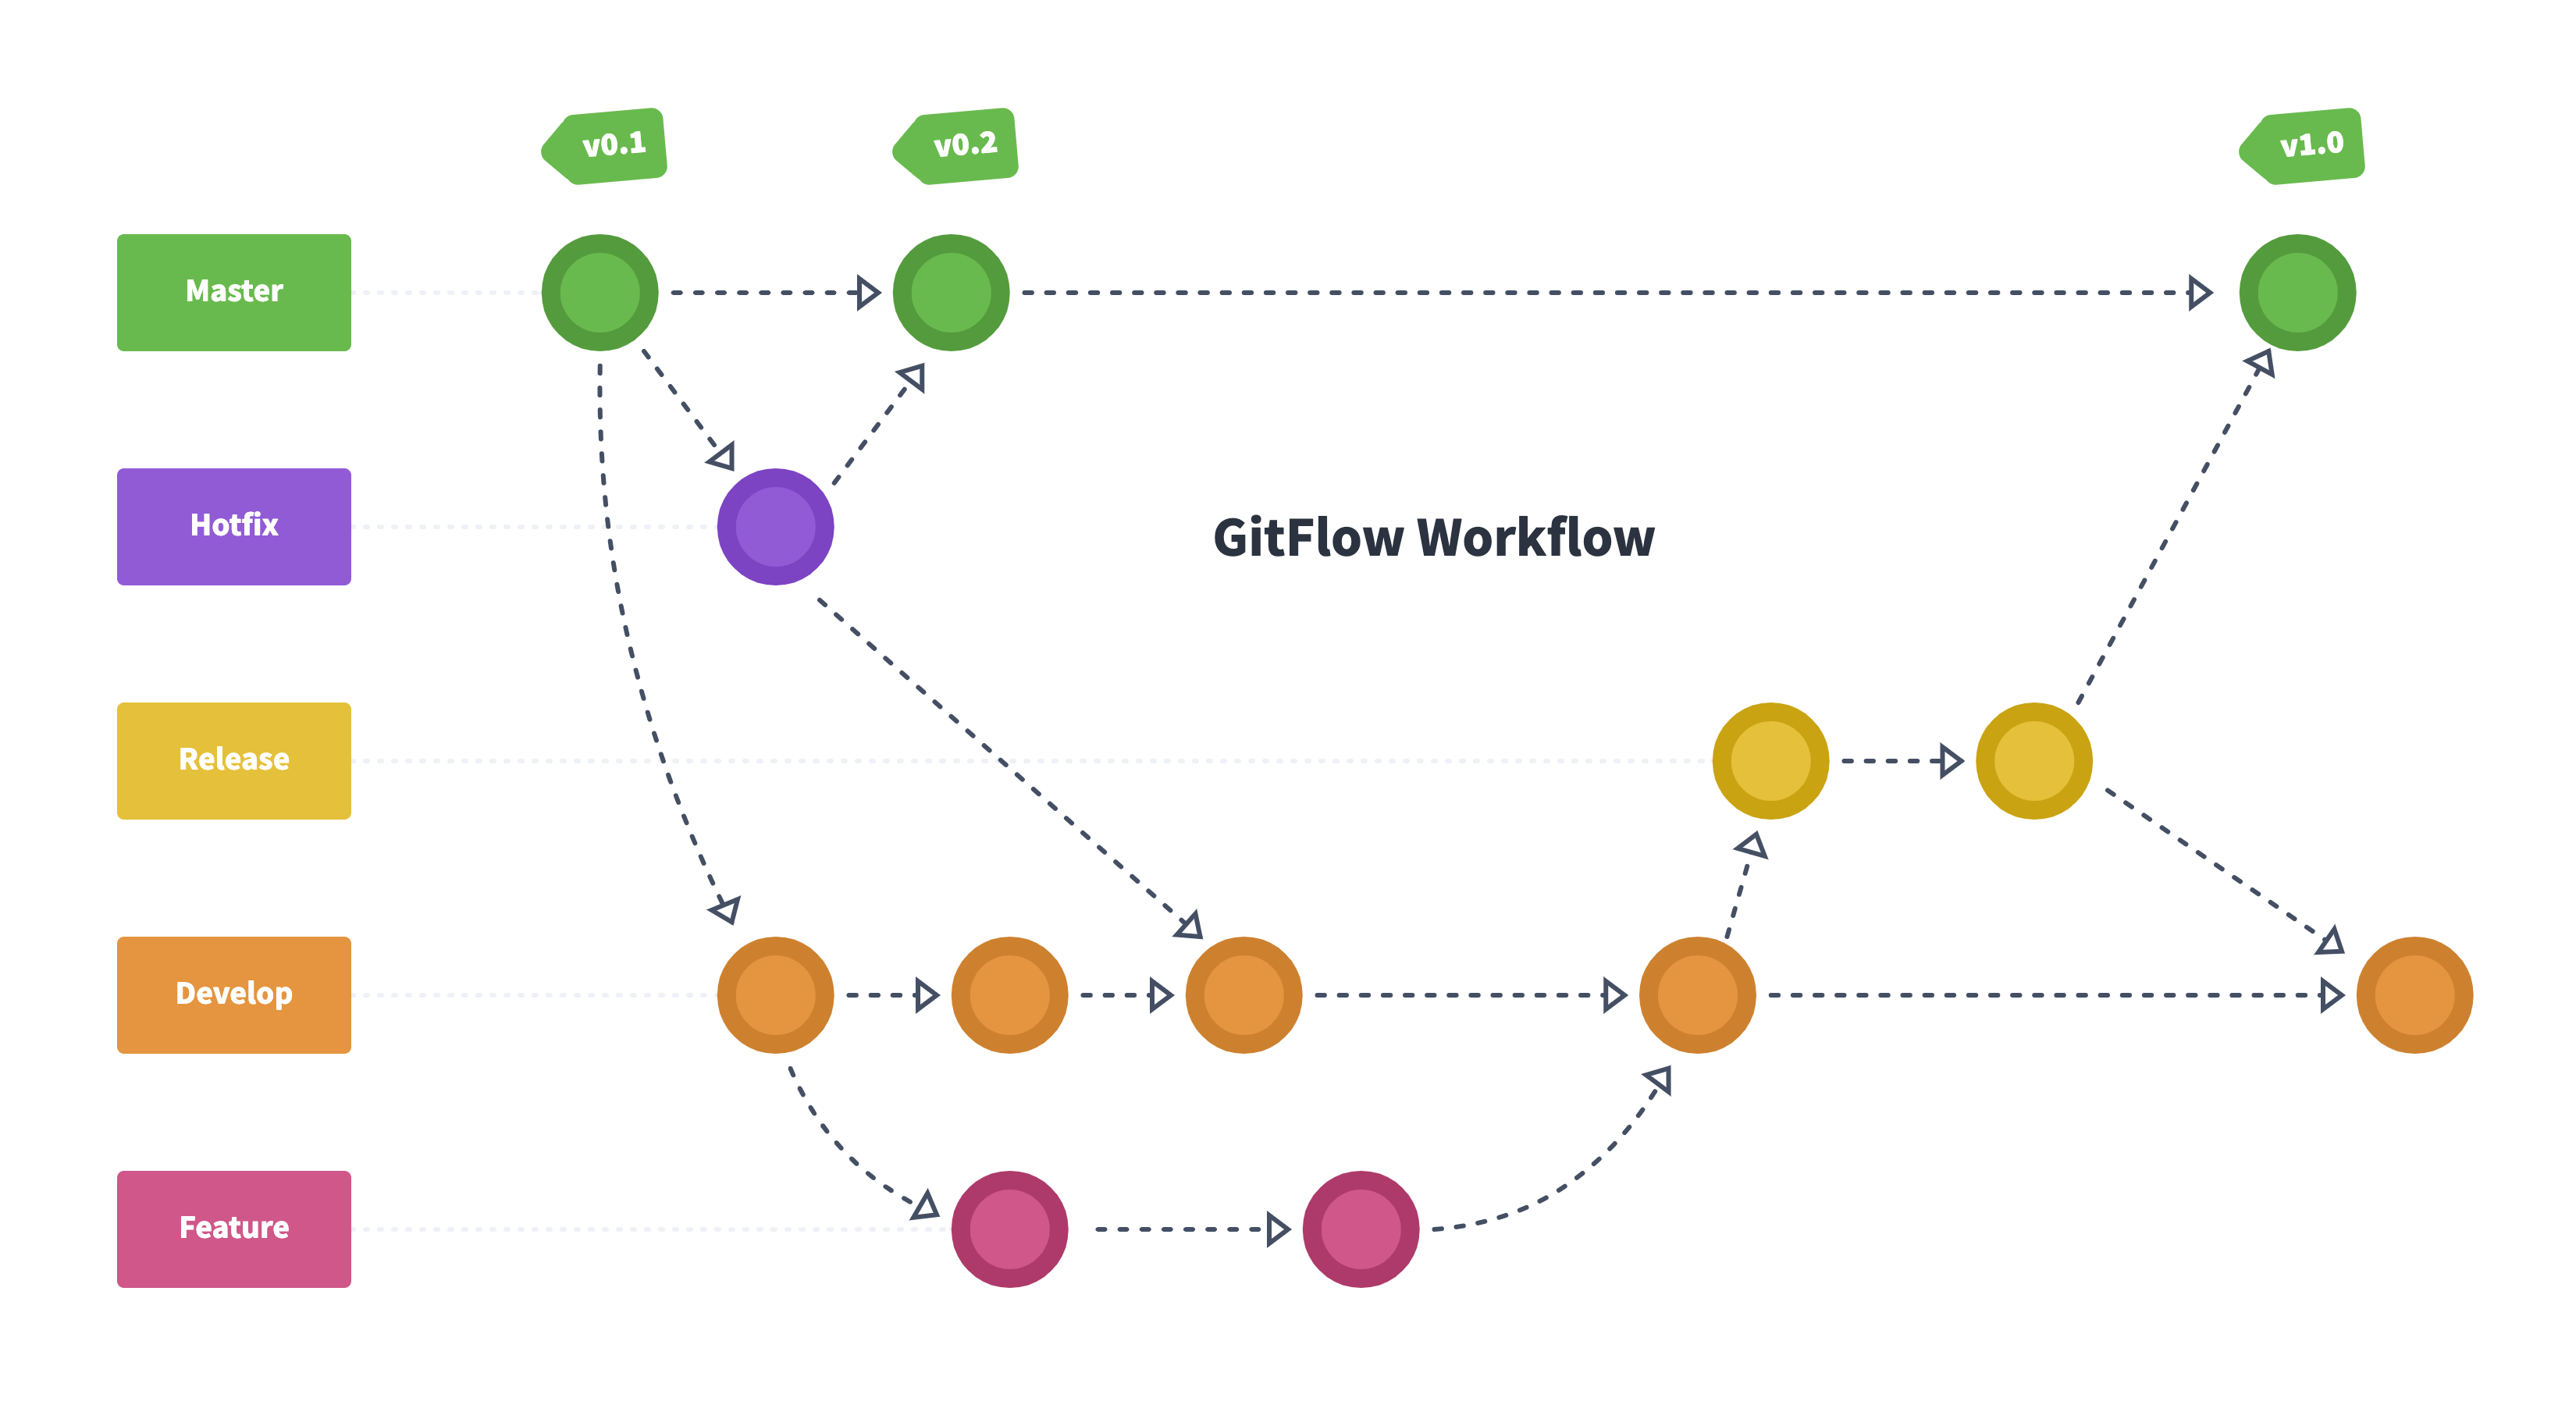
GitFlow is a branching model for Git that helps teams manage their code more easily. It sets up a clear way to handle different stages of development, like building new features, prepping for releases, and fixing bugs.
There are commands for every step, like "git flow init" for initializing, "git flow feature start name" and "git flow feature start finish" for feature development, "git flow release start x.y.z" and "git flow release finish x.y.z -m 'message'" for releases etc.
- Master/Main: This is where your production-ready code lives.
- Develop: This is where all the new features come together before they go live.
- Feature: Use this branch for working on new features. It is created from develop and merge into it.
- Release: This is for getting everything ready for production. Is created from develop and merge into it and main.
- Hotfix: Quick fixes can be made here when something needs urgent attention. Is created from main, merge into it and develop.
By utilizing GitFlow, learn the fundamental development workflow associated with this approach and technology, which is seamlessly integrated and ready to use within Git.
## SonarQube
.png)
SonarQube is an open-source platform used for continuous inspection of code quality. It helps developers manage code quality by identifying bugs, vulnerabilities, and code smells in their projects.
SonarQube can be seamlessly integrated with Jenkins, a popular continuous integration and continuous delivery (CI/CD) tool. This integration allows you to automatically analyze your code after each build.
Initially, to test it, run the command below.
```
docker-compose -f docker-compose.sonar.yml up -d
````
Then, acessing the sonarqube dashboard on port 9000 with the credentials 'admin' and 'admin', is possible to create a new project and a token. After this step, fill the fields with the respective values and run the command:
```
docker run \
--rm \
--network=host \
-e SONAR_HOST_URL="http://127.0.0.1:9000" \
-e SONAR_SCANNER_OPTS="-Dsonar.projectKey=project_name" \
-e SONAR_TOKEN="secret_token" \
-v "project_absolute_local_path:/usr/src" \
sonarsource/sonar-scanner-cli
````
## Prometheus and Grafana

### Prometheus - Data Collecting
Prometheus is a monitoring tool that excels at collecting system and application metrics in real-time.
Prometheus uses a pull-based metric collection model, where it makes HTTP requests to endpoints exposed by applications. The route "/metrics" is being used on this project.
The client libraries are libraries that help implement data collection in applications.
This project is using the third party library Spatie Laravel-Prometheus that configures the PHP client library in laravel.
For services that do not expose metrics natively (such as databases, servers, etc.), exporters are used, they are custom collectors.
### Grafana - Data Visualization
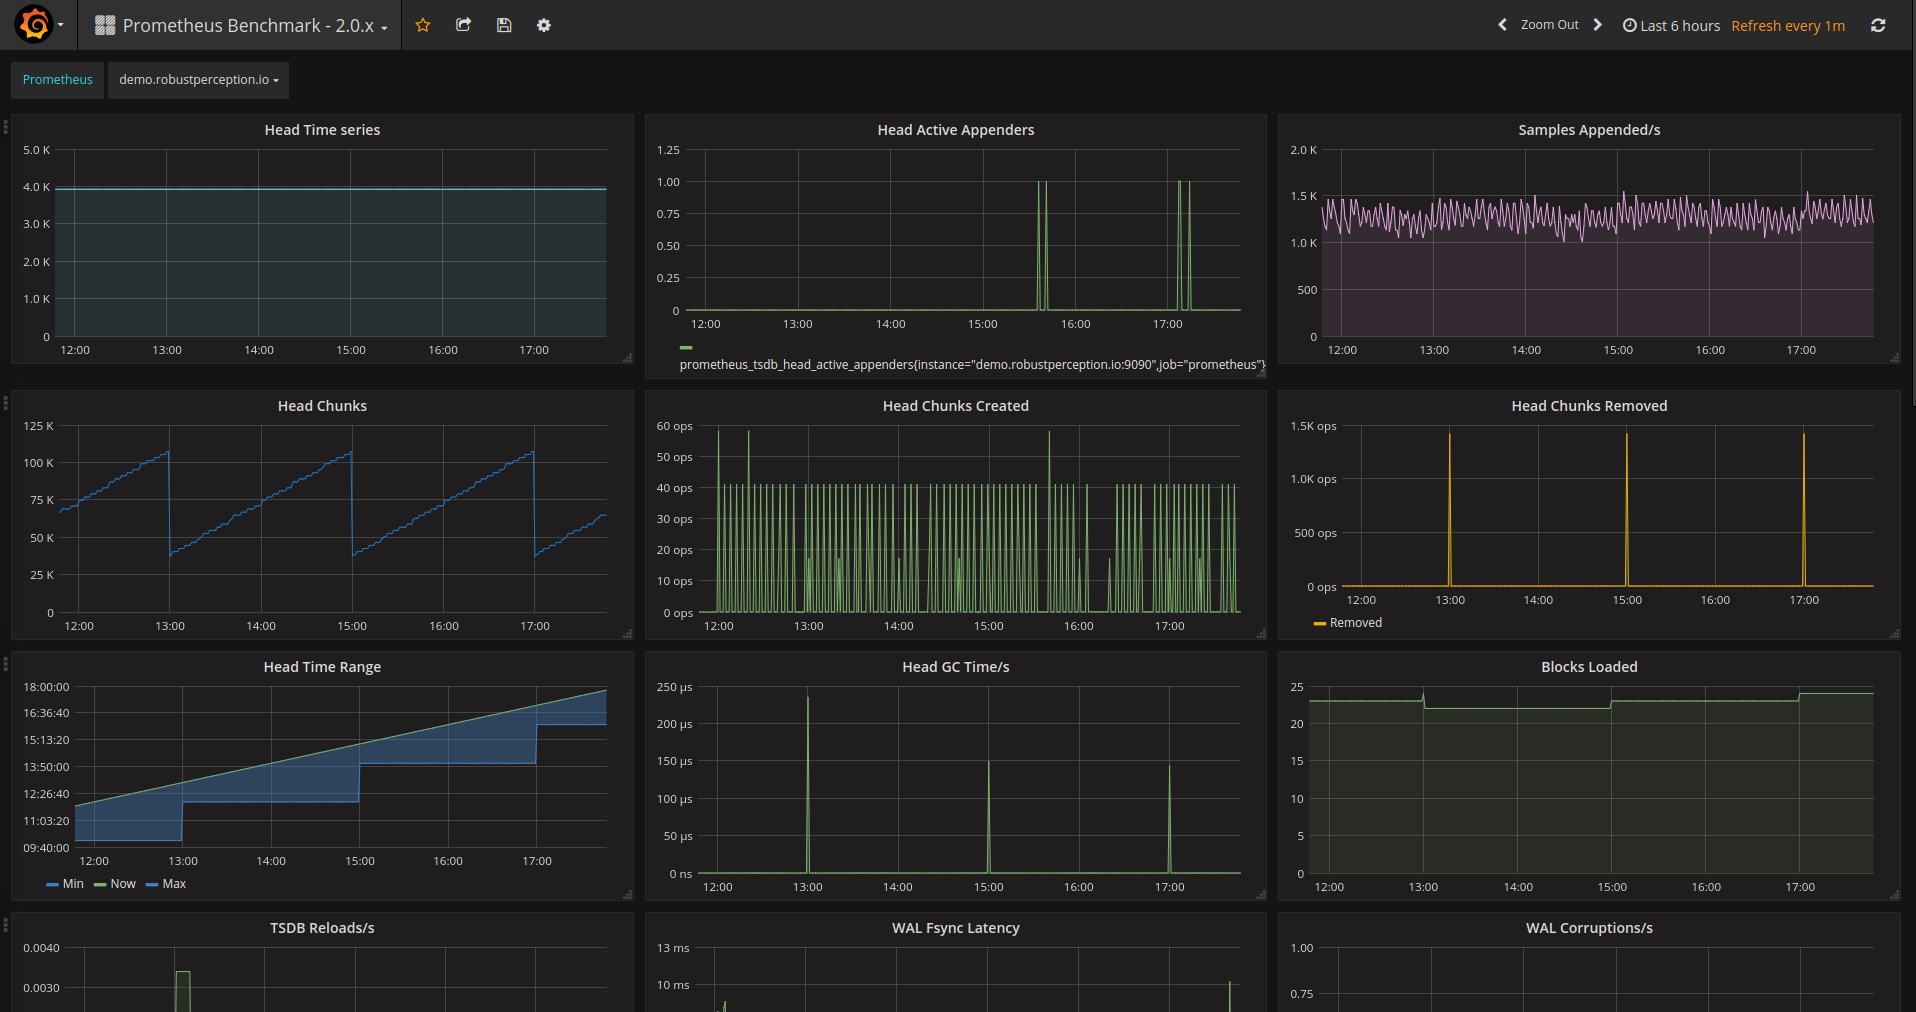
Grafana is a data analysis and visualization platform that allows you to create interactive and customizable dashboards. It integrates with multiple data sources, including Prometheus, to provide rich visualizations and insights into the metrics collected.
### Usage
They were integrated into the project via Docker. To test them, simply run the docker-compose.yml file.
Prometheus is accessible on localhost:9090, while Grafana can be accessed on localhost:3000.
```
docker-compose -f docker-compose.yml up -d
````
To access the Prometheus dashboard, go to localhost:9090 and click on "Status -> Targets" to view the status of the configured endpoints in prometheus.yml.
Next, access the Grafana dashboard at localhost:3000 using the credentials "admin" for both username and password. Go to "Connections" and "Data Sources" to add a new data source, selecting Prometheus and entering the URL http://prometheus:9090.
Once configured, Grafana will receive data from Prometheus! You can also use a custom dashboard by going to "Dashboards," clicking "New -> Import," and entering the ID of a dashboard available on the Grafana website, like this one.
## Jenkins

Jenkins is an open-source automation tool that facilitates continuous integration and continuous delivery (CI/CD) of software
It is typically installed on a standalone server, and through an intuitive web interface, you can configure and monitor projects, creating jobs, accessing execution logs, and configuring a lot of other stuffs.
### Github Integration
One of its main features is integration with remote repositories, such as Github. This integration can be done in different ways, such as through polling, where Jenkins periodically checks for updates, or using webhooks, where GitHub notifies Jenkins whenever a push or pull request is made.
### Jenkinsfile
The pipeline is usually defined in a file called Jenkinsfile. This file allows you to describe the entire pipeline process.
The pipeline process is run by runners, which work similarly to GitHub Actions agents. They don't come pre-configured, which means that in order to build and test a Laravel project, Jenkins needs to run on a machine with the features required by the application.
### Local Usage
To test Jenkins locally, was used a Container with all the resources needed to run Laravel, configured from the Dockerfile.jenkins and docker-compose.jenkins.yml. By default, Jenkins will be accessible on localhost port 8080.
```
docker-compose -f docker-compose.jenkins.yml up -d
````
## Github Actions
GitHub Actions is an automation tool built into GitHub that allows you to create workflows to automate tasks related to software development.
- Workflows: YAML files in the .github/workflows directory, triggered by events such as push or pull request.
- Jobs and Steps: Workflows contain jobs (executed in parallel or sequence) composed of steps (individual tasks).
- Actions: Building blocks that can be community actions or created by you.
- Environments and Variables: Allow you to define variables and use secrets for sensitive information.
- Integration: Works with a variety of tools, facilitating automations throughout the development process.