https://github.com/markbattistella/docsify-charty
Transform your markdown into graphs and charts for docsify
https://github.com/markbattistella/docsify-charty
chart docsify docsify-js docsify-plugin graph
Last synced: 5 months ago
JSON representation
Transform your markdown into graphs and charts for docsify
- Host: GitHub
- URL: https://github.com/markbattistella/docsify-charty
- Owner: markbattistella
- License: mit
- Created: 2021-03-01T07:35:09.000Z (over 5 years ago)
- Default Branch: main
- Last Pushed: 2024-06-12T02:23:11.000Z (about 2 years ago)
- Last Synced: 2025-09-25T21:47:32.224Z (9 months ago)
- Topics: chart, docsify, docsify-js, docsify-plugin, graph
- Homepage: https://charty.docsify.markbattistella.com/
- Size: 814 KB
- Stars: 13
- Watchers: 1
- Forks: 8
- Open Issues: 0
-
Metadata Files:
- Readme: README.md
- Changelog: CHANGELOG.md
- License: LICENSE
Awesome Lists containing this project
- awesome-docsify - docsify-charty - Add some charts and graphs to your docsify website. Pie charts, doughnut charts, sectional, bar and column graphs, line and plot graphs, and a review block. Everything you need if you need to visualise some numbers! (Plugins)
README
# docsify.js charty
This plugin enhances your Docsify documentation by adding SVG charts to your website. It allows you to add in multiple types of charts, including pie, doughnut, sectional, radar, area, scatter, line, and bar types. By utilising this plugin, you can easily show your data in a beautiful interface.
## Installation
### Update `index.html` file
Assuming you have a working [docsify](https://docsify.js.org/) framework set up, it is easy to use the plugin.
1. Add the following script and stylesheet to your `index.html` via either CDN or downloading it and using it locally:
```html
```
1. In docsify setup, configure the plugin:
```js
window.$docsify = {
charty: {
// Global theme for chart colours in HEX
theme: '.',
// Accepts "dark" or "light"
mode: "light",
// Boolean to enable or disable debug messages
debug: false
}
};
```
## Configuration
There are several options available for the docsify-charty plugin:
> Example: [index.html](https://github.com/markbattistella/docsify-charty/blob/b792e7701e740587f48598c7b61bc7f7ea39c366/docs/index.html#L36-L40)
| Name | Type | Example | Description |
|---------|-----------|-----------|-------------------------------------------|
| `theme` | `String` | "#EE5599" | Global theme for chart colours in HEX |
| `mode` | `String` | "light" | Accepts "dark" or "light" |
| `debug` | `Boolean` | false | Console logs if charts aren't loading |
### Per chart settings
| Name | Accepts | Description |
|-------------------|---------------|------------------------------------------|
| `title` | `String` | The title of the chart, displayed at the top. Leave blank if you want to hide it |
| `caption` | `String` | The sub-text of the chart, displayed under the title. Leave blank to hide it |
| `type` | `String` | The type of charty you want to display |
| `options.theme` | `String` | Set an individual theme to this chart. It will override the global theme |
| `options.legend` | `Boolean` | Show the legend. Default `true` |
| `options.labels` | `Boolean` | Show the chart labels. Default `true` |
| `options.numbers` | `Boolean` | Show the chart numbers. Default `true` |
| `data.label` | `String` | Graphed data point label |
| `data.value` | `Int / Array` | Graphed value that puts it on the render |
| `data.colour` | `String` | Override the global and theme with a specific colour |
### Markdown code
```js
```charty
{
"title": '',
"caption": '',
"type": '',
"options": {
"theme": '',
"legend": '',
"labels": '',
"numbers": ''
},
"data": [
{
"label": '',
"value": '',
"colour": ''
}
]
}
\`\`\`
```
## Types of charts
### Circular
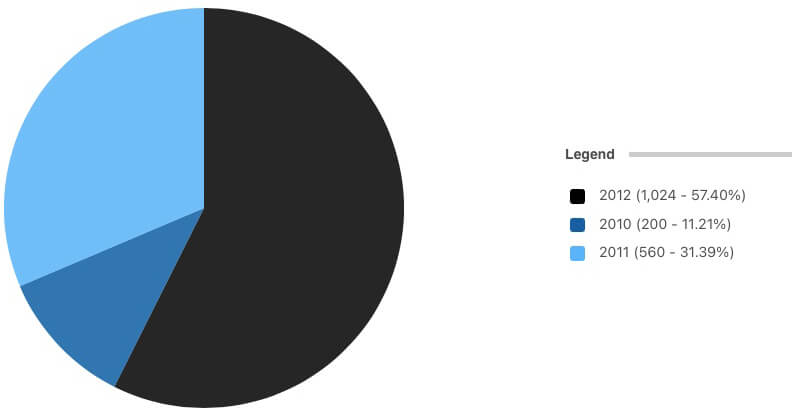
#### Pie chart
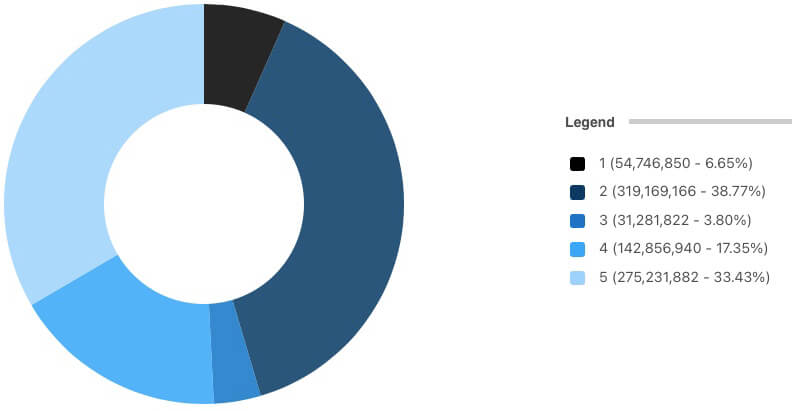
#### Donut / Doughnut chart
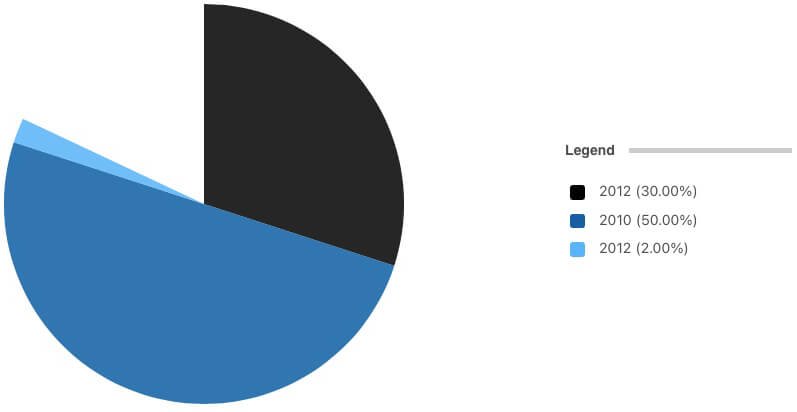
#### Section / Sectional chart
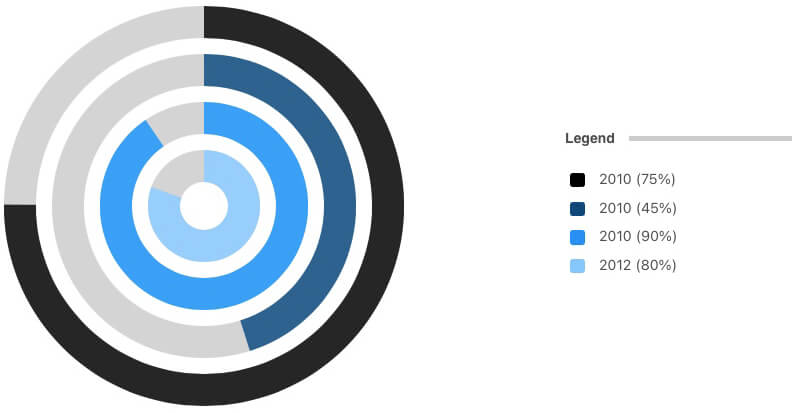
#### Rings chart
### Area
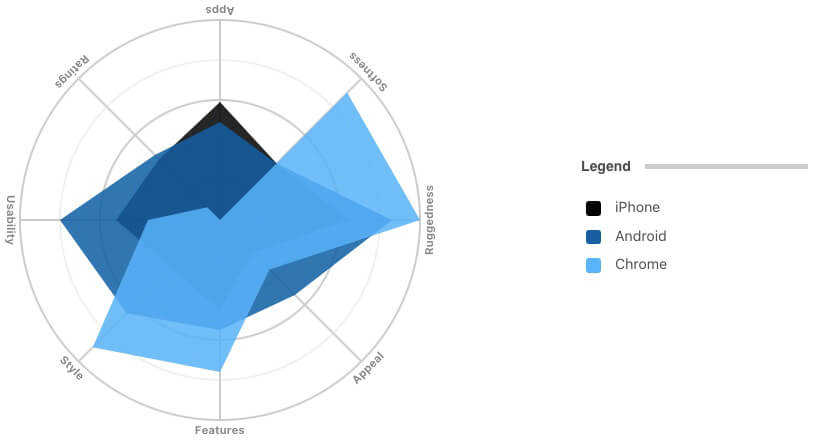
#### Radar chart
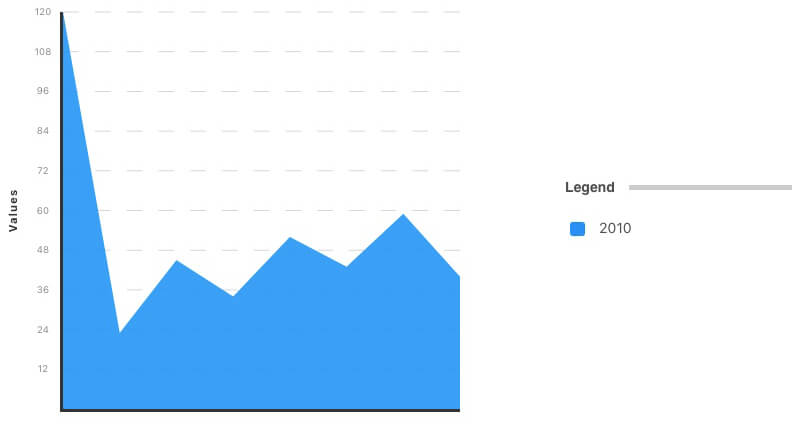
#### Area chart
### Plot
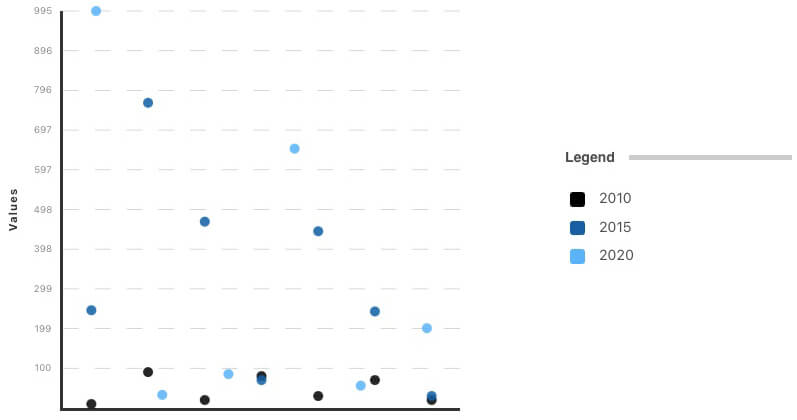
#### Scatter chart
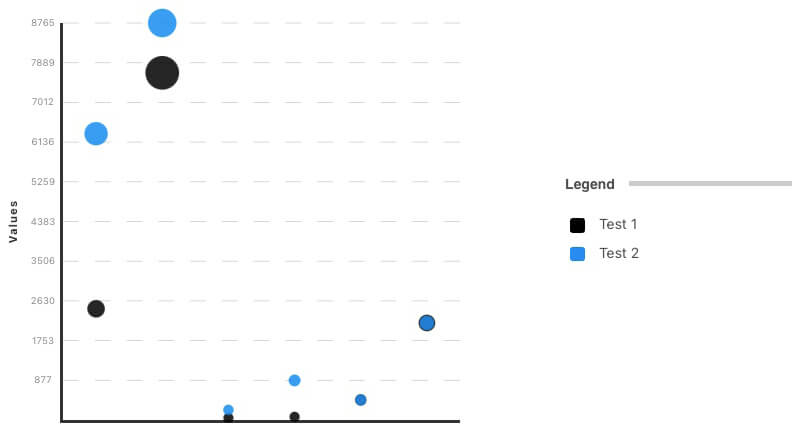
#### Bubble chart
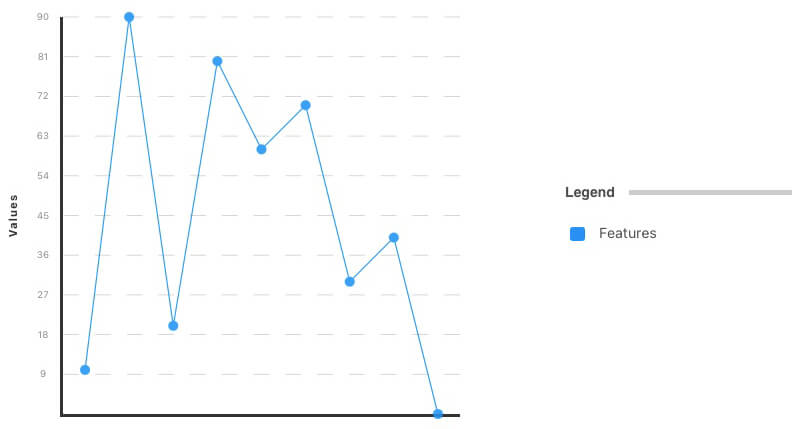
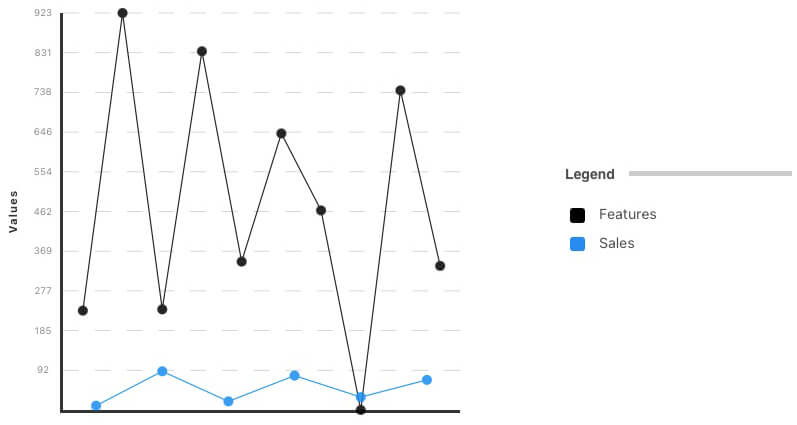
#### Line chart
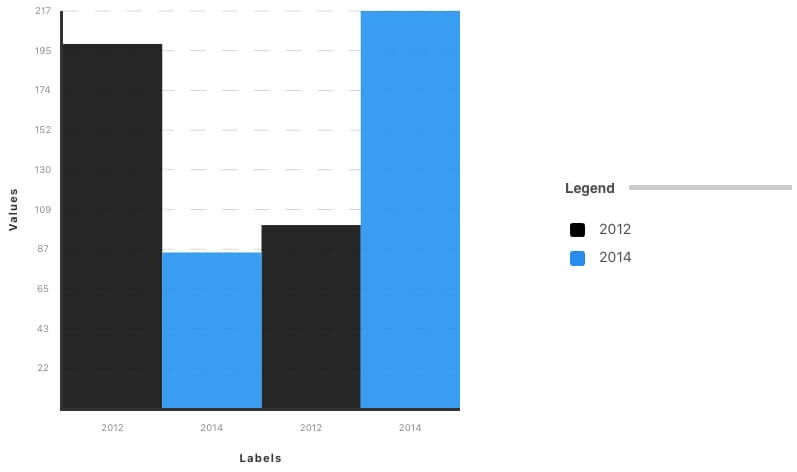
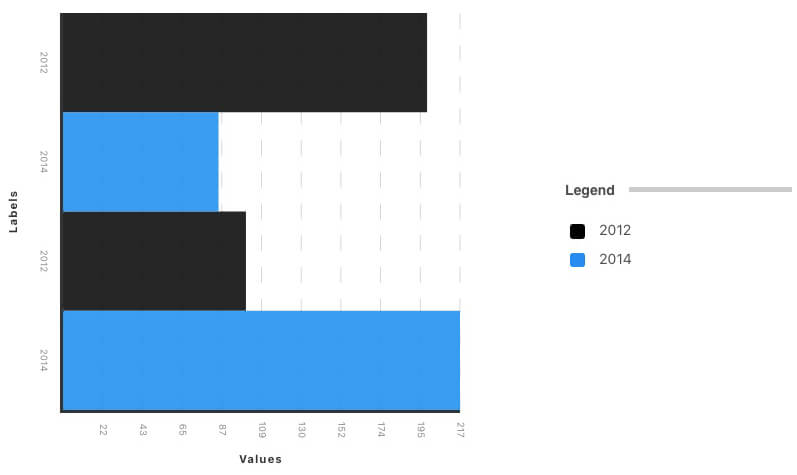
### Bar / Column
### Bar / Bar-stack chart
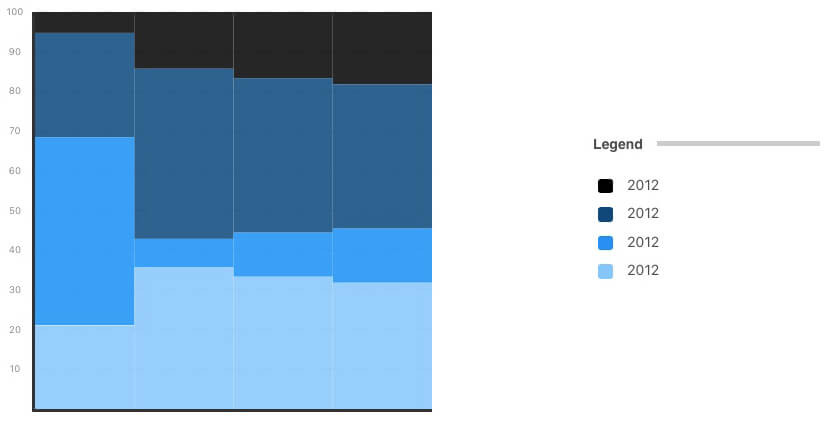
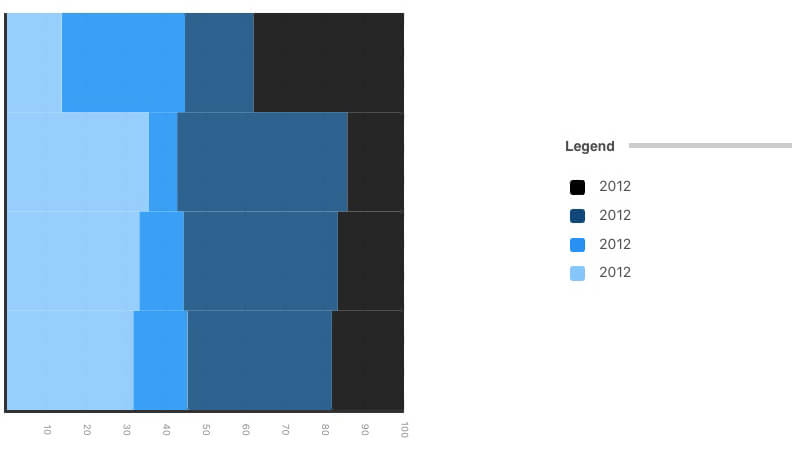
### Column / Column-stack chart
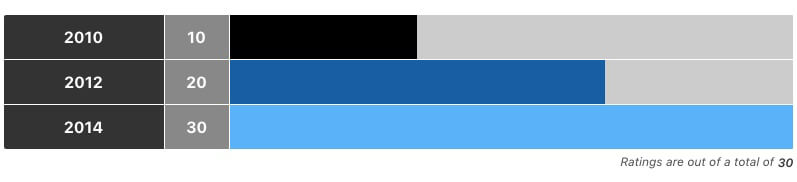
### Rating
## Contributing
1. Clone the repo: `git clone https://github.com/markbattistella/docsify-charty.git`
1. Create your feature branch: `git checkout -b my-feature`
1. Commit your changes: `git commit -am 'Add some feature'`
1. `Push` to the branch: `git push origin my-new-feature`
1. Submit the `pull` request